Who is Prosus N.V.?
Naspers's Dutch subsidiary, holding a stake in Tencent and internet businesses: food delivery, classifieds, payments.
Value and financial structure
178 Bn $ in gross assets8.9 % funded by borrowingthe share price 38.98 € against 65.49 € of net asset value per share (gap computed by Opulion −40.5 %)
What you own
Reporting date|Out of total assets of178 275 M $
By type
Listed or unlisted, and in what form.
Gross assets
178 Bn $
at Mar 31, 2026
Pick a part to see what it holds.
Inside: or . Outside: the type of asset.
What the company owes
8.9 %debt-financedat Mar 31, 2026
Net debt, after cash: 6.4 Bn $
Published loan to value, on net debt: 4.2 % as at Mar 31, 2026.
How this figure is calculated
It relates net debt to the market value of listed assets, plus half that of unlisted assets and central cash, rather than gross borrowings to gross assets: that is why it differs from the share above.
These borrowings are the investment company's own — the ones its published bridge to net asset value deducts. They cover the same perimeter as the gross assets the chart divides, so the share above really does measure how much of those assets is debt-financed.
Source: Prosus financial results fy26 booklet
By theme
What the companies held do, in fifteen themes.
Sorted by theme
91 %
of gross assets
Pick a theme to see its companies.
As a share of gross assets, on the lines whose weight the company publishes. Themes defined by Opulion, the same on every page, not by the company.
Company by company
Names as published, as of Mar 31, 2026 unless another date is shown.
49 named holdings: 19 with a weight, 12 listed. 5 are also held by another company followed on Opulion.
With their weight19
messaging, social networks, games and payments
71.6 %online classifieds
4.9 %- iFood
food and grocery delivery in Brazil
4.2 % online food delivery
2.6 %online payments in emerging markets
1.6 %food delivery and local services
1.1 %e-commerce in Romania
1.1 %- Despegar
online travel agency
1.0 % - Swiggy
food and grocery delivery in India
0.9 % - Delivery Hero
food and grocery delivery
0.8 % online payments in Turkey
0.6 %- Meesho
low-cost online marketplace in India
0.4 % - OLX Brasil
online classifieds in Brazil
0.2 % online international money transfers
0.1 %on-demand home services
0.08 %online travel in India
0.07 %omnichannel jewelry retail in India
0.02 %web data and audience measurement
0.02 %online corporate training
0.01 %
10
online classifieds in the Middle East
37.59 %of capitalride-hailing and motorcycle taxis in India
23.52 %of capitalB2B logistics, fulfilment and last-mile delivery for brands in India
22.63 %of capitalonline travel in India
16.18 %of capitalpoint-of-sale and management software for restaurants
12.64 %of capitalonline continuing education with universities
12.45 %of capitalonline pharmacy and diagnostics in India
11.08 %of capital- Mintifi Finserve Private Limited
supply chain financing in India
10.93 %of capital seafood sourcing and processing
10.44 %of capitalhome loans to households in India
8.22 %of capital
15
- Despegar.com Corp
Latin American online travel agency
100.0 %of capital online payments (Turkey)
100.0 %of capitalonline food delivery
100.0 %of capital- PaySense Private Limited
online consumer lending in India
100.0 %of capital online payments in India
100.0 %of capitalonline payment gateway
100.0 %of capital- Stack Overflow Limited
Q&A platform for developers
100.0 %of capital payment security and processing
100.0 %of capital- La Centrale Holding SAS
online car classifieds
99.0 %of capital - OLX Global B.V.
online classifieds (OLX)
99.0 %of capital - iFood.com Agência de Restaurantes Online S.A.
food delivery in Brazil
96.23 %of capital online ticketing and event management in Brazil
96.23 %of capital- Dante International S.A. (eMAG)
e-commerce in Eastern Europe (eMAG)
88.23 %of capital instant payment software for banks
70.7 %of capitalonline training for corporate employees
70.1 %of capital
5
loyalty, rent payments and credit card
online secured lending in Brazil
AI-powered legal contract management software
online private tutoring
working capital financing for e-merchants
The news feed
Up to date as of
Our latest articles on this company
The whole journalProsus: iFood already supplies a quarter of Despegar's Brazilian consumer revenue
The travel platform offers a tangible measure of Prosus's ecosystem strategy. It tracks sales linked to iFood, not yet incremental profit for the holding company.
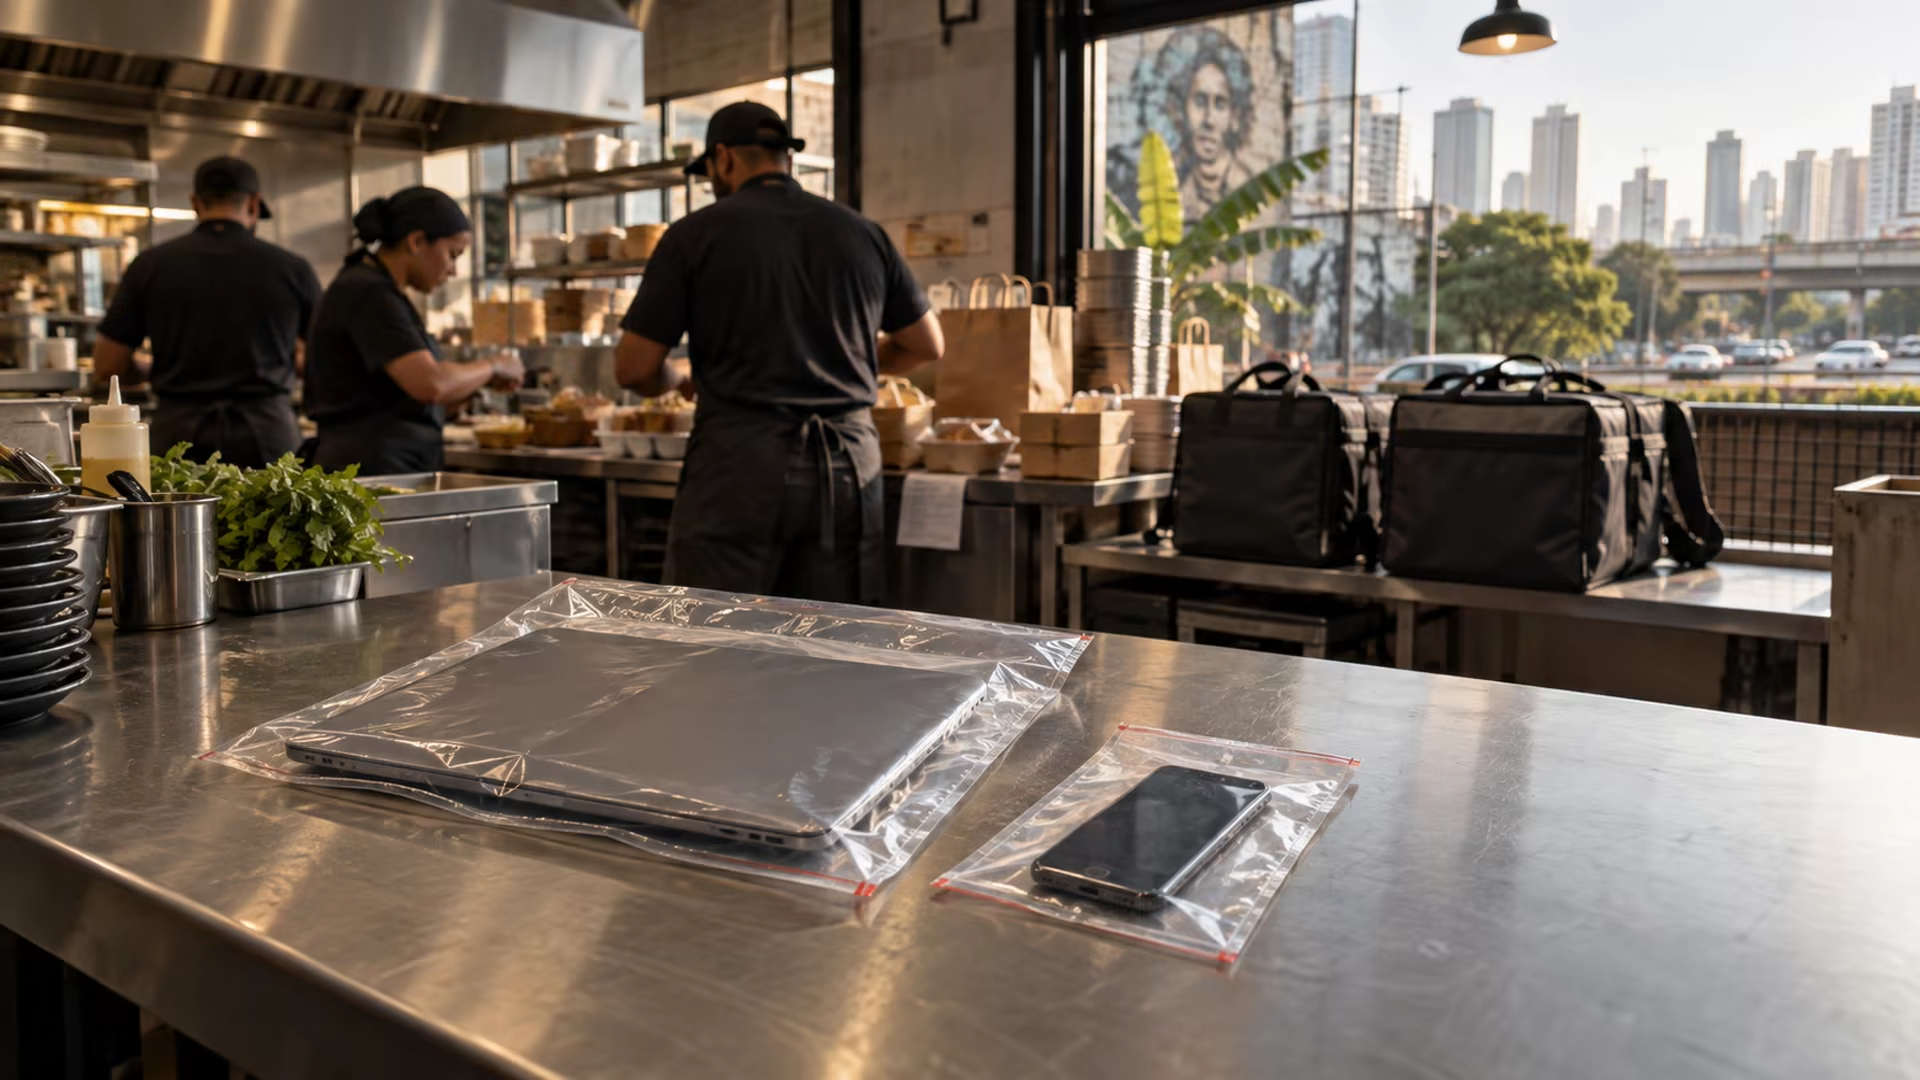
iFood: a police seizure reveals the data battle behind Prosus's asset
A computer and phone have been seized from a former commercial executive. No unlawful use has been established, but the investigation shows why restaurant data have become a strategic asset in Brazil's delivery war.
iFood plans BRL24 billion of investment: why Prosus is defending more than meal delivery
Restaurants, supermarkets, pharmacies, payments and artificial intelligence: Brazil's champion wants to become a commerce infrastructure. The number is striking, but its scope still needs clarification.


Upcoming publications
- Nov 16, 2026 to Nov 30, 2026Half-year reportInterim results to 30/09/2026 (date not yet published by Prosus)date estimated from the usual schedule
- Dec 1, 2026DividendPayment of the distribution of about EUR 0.28 per share (capital repayment, or dividend on election until 23/11/2026)
- Jun 15, 2027Annual reportFY2027 annual results and annual reportdated commitment by the issuer
- Aug 15, 2027Annual general meetingAnnual general meeting 2027dated commitment by the issuer
What it has returned
Reporting date
Against the same world benchmark for all.
Published performance,
World index in euro, EUR, per year
Company figures as of Mar 31, 2026 · world index as of Mar 31, 2026
The company does not publish a return over one, three, five or ten years.
Method and sources
Each panel carries its own scale: lengths compare within a panel, never from one panel to the next.
A return is never converted from one currency to another: that would take the exchange rate move over the whole period, not the rate on one reporting date. The company's series are served in the issuer's currency only.
Every company covered is compared with the same benchmark, never with the index their own manager picked: a manager who picks his index also picks the bar he had to clear. This benchmark is not the MSCI ACWI itself, which belongs to MSCI and may not be redistributed. It is the median, recomputed by Opulion, of the net asset values published by three ETFs from three different managers tracking that index: iShares (IE00B6R52259), State Street SPDR (IE00B44Z5B48) and Amundi (LU1829220133). A single fund is never served on its own. Convention: last net asset value on a date at or before the reporting date, within a seven calendar day window; geometric annualisation over the nominal horizon; conversion at the European Central Bank reference rate of the day of the net asset value actually retained, a cross rate being an Opulion computation that is declared as such. The recomputation reproduces the performance each manager publishes for its own fund, to the second decimal, fifteen times out of twenty, and never departs from it by more than 0.04 point. Funds used: BlackRock, State Street and Amundi.
Converted at the reference rate of Mar 31, 2026, published by the European Central Bank.
What is it worth on the market?
Reporting date
The share price against net asset value per share.
Values shown in euro, EUR
65.49 €
the company's calculation
Share price
38.98 €
stock exchange close that day, not a price used by the company
Price to net asset value gap
−40.5 %
computed by Opulion: the stock exchange close against the same-day net asset value per share. Its unlisted companies are valued on an average of analysts' estimates, which Prosus does not endorse.
Performance over time
Long termNo long-term series available for this company.
The share price
MarketThe share price, to read against the published net asset value above.
Getting to know Prosus
Each answer links to its source.
Who decides?
Naspers, its South African parent. It owns 43.4 % of the capital but 75.7 % of the votes, because it also holds all the B shares, which carry one vote each, like the listed shares, but only a tiny slice of the profits.
Sourceprosus.comWhat does it own?
First, 22.7 % of Tencent, the Chinese internet group, or 71.6 % of the gross value of its assets, before debt. The rest is mostly food delivery, classifieds and payments businesses: iFood in Latin America, OLX in Europe, PayU in India.
Sourceprosus.comHow does it choose its investments?
It now describes itself as an "active operator": region by region, it assembles "ecosystems" of everyday apps, food, payments, classifieds. It has picked three regions, Latin America, India and Europe, and puts AI first in each of them.
Sourceprosus.comHow does it make money?
Its core headline earnings, 8 300 M $, its measure of after-tax operating profit, come mostly from its share of Tencent's profits. In actual cash, it collects Tencent's dividend, the profits of its own companies and the proceeds of disposals.
Sourceprosus.comHow are shareholders paid?
Mainly through share buybacks, run continuously with no end date: they have removed 32 % of the free float, the shares held by the public. On top comes a payout of 0.28 € per share, taken either as a dividend or as a capital repayment.
Sourceprosus.comWhat sets it apart
Its buybacks are paid for by Tencent: it regularly sells small amounts of Tencent shares while buying back its own. Naspers does the same one floor up, selling Prosus shares to buy back its own stock.
Sourceprosus.com
Who runs it, and since when?
How long they have been there
Tenure on the board and in management
- Koos Bekker· Chair of the Board of Directors2019
- Fabricio Bloisi· Director, Chief Executive Officer (CEO)2024
- Nico Marais· Director, Chief Financial Officer (CFO)2025
- Phuthi Mahanyele-Dabengwa· Director2025
- Hendrik du Toit· Lead independent director2019
- Rachel Jafta· Independent director, chair of the nomination committee2019
- Angelien Kemna· Independent director, member of the audit committee2021
- Craig Enenstein· Independent director2019
- Manisha Girotra· Independent director2019
- Sharmistha Dubey· Independent director2022
- Debra Meyer· Independent director, member of the remuneration committee2019
- Ying Xu· Independent director, member of the remuneration committee2020
- Mark Sorour· Director2019
- Arnold Goldberg· Independent director2026
Company facts
Value and financial structure
- 85 742M €Market capitalisation, calculated by Opulion, at Jul 31, 2026 (not the reporting date of this page)
- 53 781M $at Mar 31, 2026
- 6.4Bn $at Mar 31, 2026
- 65.49 €at Mar 31, 2026
- Registered office
- Amsterdam, NL
- Headcount
- 41998 consolidated group
- Headcount as at
- Mar 31, 2026
Tested against the figures
- 7.3 Bn $Mar 31, 2026