Who is Gimv NV?
A listed investment company that helps unlisted companies in Belgium, the Netherlands, France and Germany grow.
Value and financial structure
2.5 Bn € in gross assets14.1 % funded by borrowingthe share price 46.30 € against 57.20 € of net asset value per share (gap computed by Opulion −19.1 %)
What you own
Reporting date|Out of total assets of2 538 M €
By type
Listed or unlisted, and in what form.
Gross assets
2.5 Bn €
at Jun 30, 2026
Pick a part to see what it holds.
Inside: or . Outside: the type of asset.
What the company owes
14.1 %debt-financedat Jun 30, 2026
Net debt, after cash: 227 M €
Published loan to value, on net debt: 9.4 % as at Jun 30, 2026.
How this figure is calculated
It divides net debt, after cash, by the value of the assets, rather than gross borrowings by gross assets: that is why it differs from the share above.
These borrowings are the investment company's own — the ones its published bridge to net asset value deducts. They cover the same perimeter as the gross assets the chart divides, so the share above really does measure how much of those assets is debt-financed.
Source: Gimv half-year report 2026 · Sep 3, 2026
By theme
What the companies held do, in fifteen themes.
Named holdings
62
sorted into 10 themes
Pick a theme to see its companies.
By number of companies: the company does not publish the weight of each line, so the ring counts names, not amounts. Themes defined by Opulion, the same on every page, not by the company. The fund held is counted separately: a fund is not a line of business.
The breakdown published by the company
By sector · Jun 30, 2026
- CO
- 17.0 %
- HC
- 21.0 %
- SI
- 21.0 %
- SC
- 20.0 %
- Anchor
- 11.0 %
- LS
- 5.0 %
- IF
- 4.0 %
- 3F
- 1.0 %
- NA
- 0.0 %
Company by company
Names as published, as of Jun 30, 2026 unless another date is shown.
64 named holdings: none with a weight, 4 listed. 1 is also held by another company followed on Opulion.
19
IT and cloud services
23.6 %of capitalconsumer earplugs and hearing protection
incontinence supplies and home care
construction and maintenance of energy and water networks
contract manufacturing of injectable pharmaceuticals
premium strollers and nursery products
electrical engineering and installations in Germany
equine veterinary clinics
building technical installations
- Hemink
sustainable building renovation and maintenance
cancer treatment centers (radiotherapy)
- Picot
gate and fence manufacturing
machines for synthetic turf sports fields
online tutoring platform
spinal surgery implants
construction and maintenance of critical infrastructure networks
communication systems for conferences and rail
private-label herbs and spices
rental of temporary heating and power equipment
11
surface treatment and painting of automotive parts
automotive sheet metal welding
Wi-Fi, IoT and private 5G wireless networks
thermal management for semiconductor testing
distribution of lasers and photonic components
contract electronics manufacturing
automated machine tool loading
lithium-ion batteries and charging systems
workholding fixtures and grippers for automation
wire parts, grids and gabions
- Witec
high-precision parts and systems for OEMs
9
pet care products
dried fruit, nuts and seeds
Fenders, chain guards and dress guards for bicycle manufacturers
multi-brand fast food (La Croissanterie)
regional specialty cheeses
premium portable lighting
- Olyn
food safety compliance software
wallpaper and wall decor
6
intensive outpatient care at home
home wound care
distribution of medical equipment and supplies
operation of therapeutic thermal spas
medical and paramedical care in long-term care facilities
plastic injection molding for pharma and diagnostics
11
protein-based agricultural biocontrol
6.05 %of capital- ONWARD
neuromodulation for spinal cord injuries
3.47 %of capital - Complement Therapeutics
drugs targeting the complement system
treatment of neuropsychiatric symptoms of Alzheimer's
heart failure monitoring
biotech developing immuno-oncology treatments
inhaled treatments for respiratory diseases
antibody-drug conjugates for cancer
biotech developing fibrosis treatments
wireless at-home polysomnography
nanoparticle-based immune tolerance biotech
4
building inspection and certification
Self-adhesive water barrier and airtightness foils for construction
technical film application and surface treatment
- Projective Group
consulting for the financial sector
1
distribution of specialty chemicals and ingredients
1
infrastructure investment company
2
- Batenburg Techniek
industrial electrification and automation
- Groupe Cap Vert
tree care and green-space maintenance
Legal structure · 1 entity
Intermediate holding companies and holding vehicles. They are not investments: they are not counted in the names above.
Sub-holdings and vehicles
Infravest
The news feed
Up to date as of
Our latest articles on this company
The whole journalGimv borrows €150m: does its leverage fit its strategy?
Net debt was 9.4% of assets at the last published balance-sheet date. The meaningful test begins when the new capital is invested in less liquid holdings.
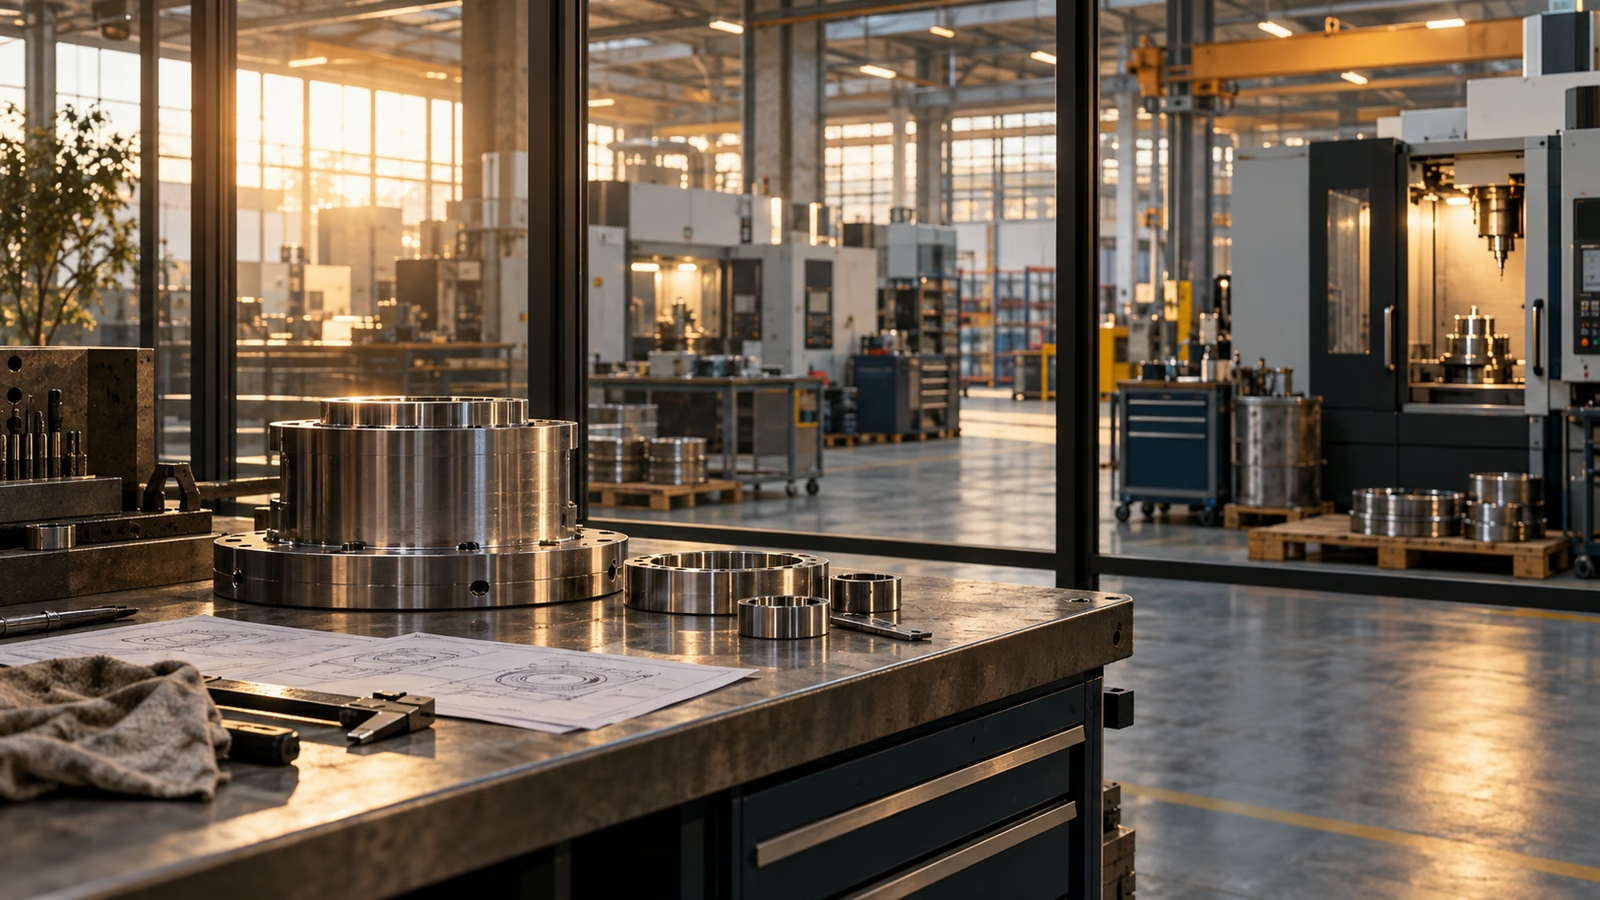
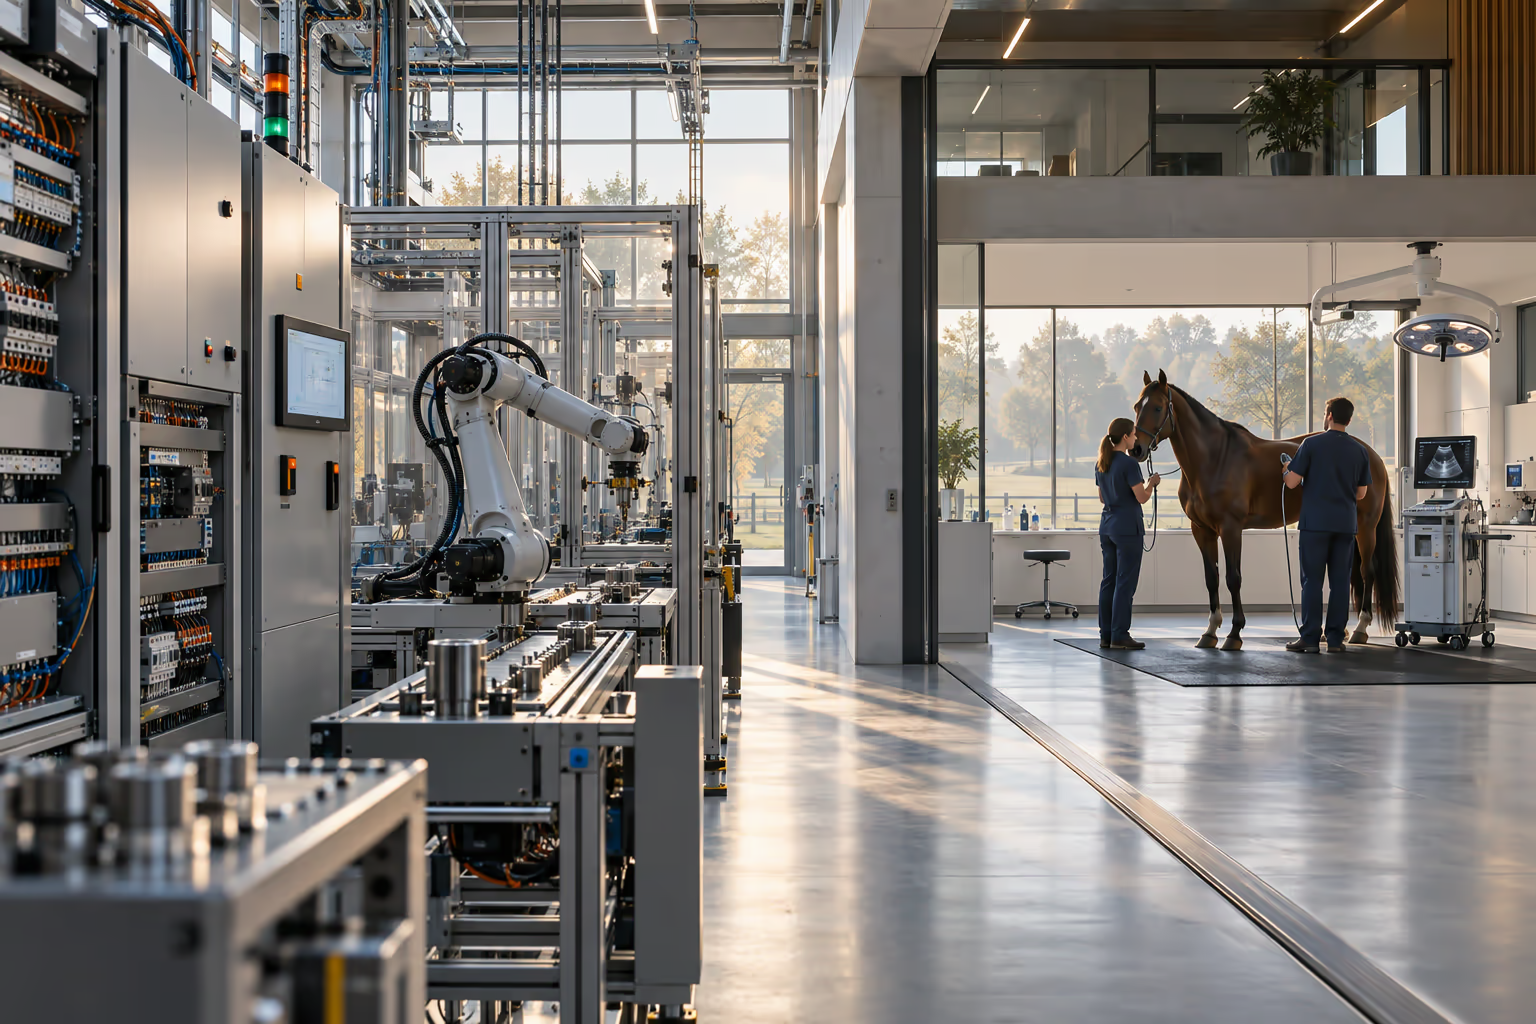
Gimv reshapes its portfolio: Anchor heads towards 15% as Equine Care expands in the US
Batenburg automates factories and power systems. Equine Care treats horses in specialist hospitals. Two deals announced on the same day reveal the two ways in which Gimv now intends to compound portfolio value.
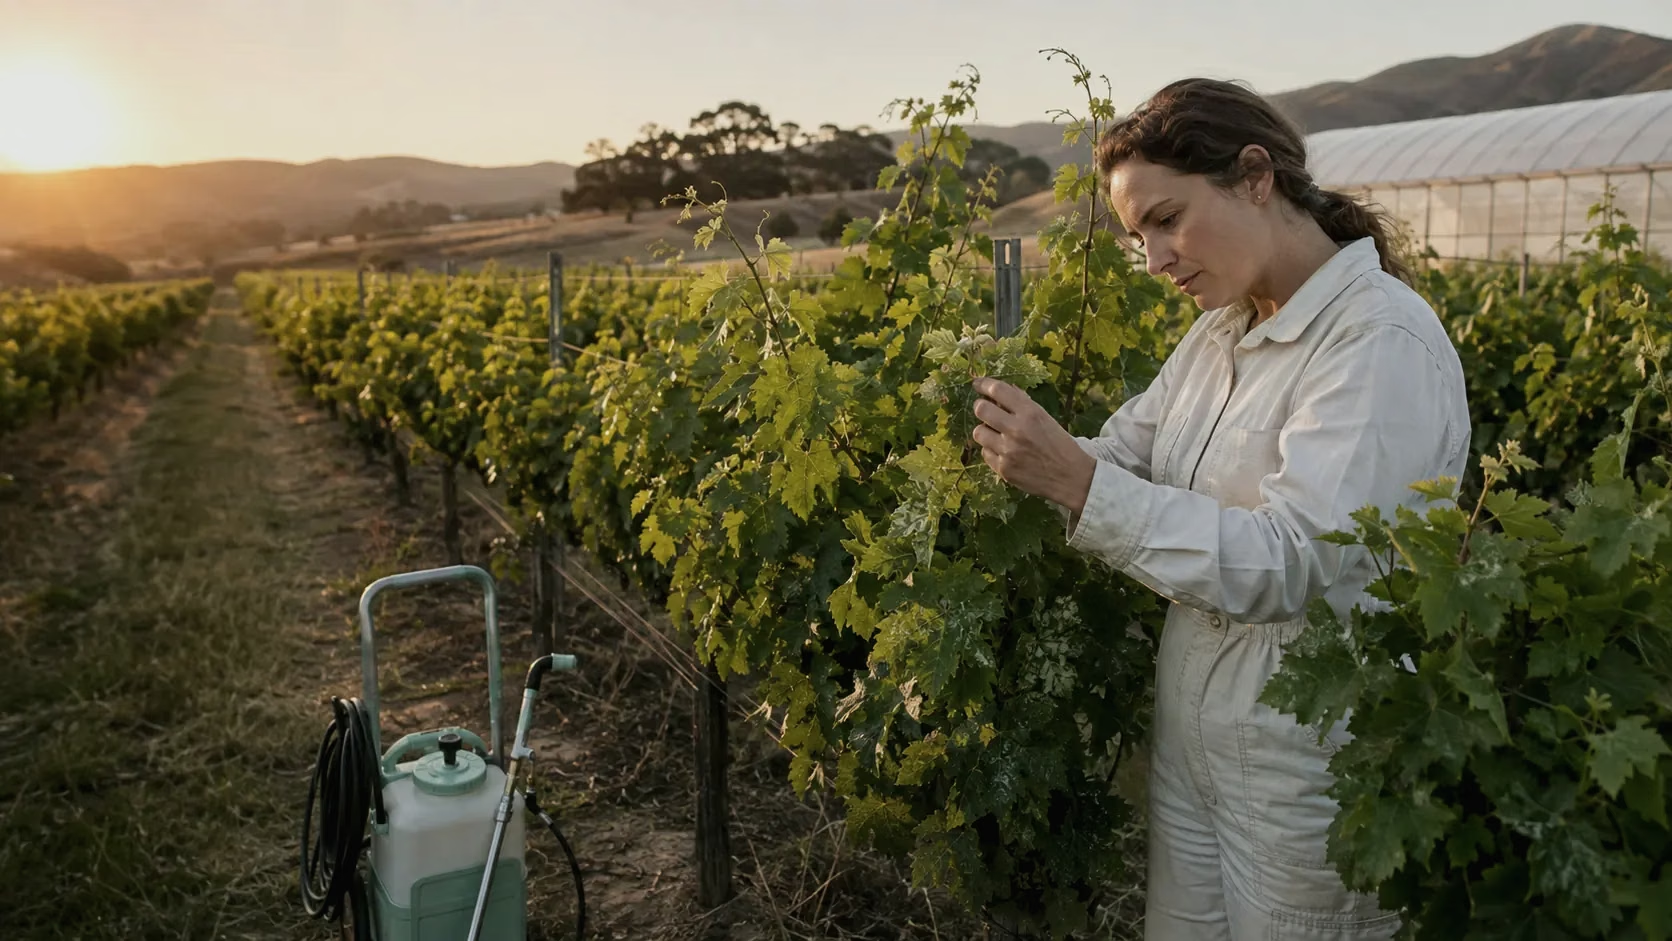
For Gimv, California reduces risk at Biotalys
EVOCA obtains registration in one of the most demanding agricultural markets. This is an important milestone for Gimv's small historical stake-but it is neither the approval of EVOCA NG nor the start of sales.
Upcoming publications
- Nov 1, 2026 to Nov 30, 2026Quarterly reportThird-quarter 2026 update (as at 30/09/2026)date estimated from the usual schedule
- Feb 18, 2027Press releaseAnnual results press release
- Mar 30, 2027Annual reportAnnual report
- May 26, 2027Annual general meetingAnnual general meeting
- Jun 1, 2027 to Jun 30, 2027Ex-dividend dateEx-dividend date, financial year 2026date estimated from the usual schedule
What it has returned
Reporting date
Against the same world benchmark for all.
Published performance,
World index in euro, EUR, per year
Company figures as of Jun 30, 2026 · world index as of Jun 30, 2026
The company does not publish a return over one, three, five or ten years.
Method and sources
Each panel carries its own scale: lengths compare within a panel, never from one panel to the next.
A return is never converted from one currency to another: that would take the exchange rate move over the whole period, not the rate on one reporting date. The company's series are served in the issuer's currency only.
Every company covered is compared with the same benchmark, never with the index their own manager picked: a manager who picks his index also picks the bar he had to clear. This benchmark is not the MSCI ACWI itself, which belongs to MSCI and may not be redistributed. It is the median, recomputed by Opulion, of the net asset values published by three ETFs from three different managers tracking that index: iShares (IE00B6R52259), State Street SPDR (IE00B44Z5B48) and Amundi (LU1829220133). A single fund is never served on its own. Convention: last net asset value on a date at or before the reporting date, within a seven calendar day window; geometric annualisation over the nominal horizon; conversion at the European Central Bank reference rate of the day of the net asset value actually retained, a cross rate being an Opulion computation that is declared as such. The recomputation reproduces the performance each manager publishes for its own fund, to the second decimal, fifteen times out of twenty, and never departs from it by more than 0.04 point. Funds used: BlackRock, State Street and Amundi.
Converted at the reference rate of Jun 30, 2026, published by the European Central Bank.
What is it worth on the market?
Reporting date
The share price against net asset value per share.
Values shown in euro, EUR
57.20 €
the company's calculation
Share price
46.30 €
stock exchange close that day, not a price used by the company
Price to net asset value gap
−19.1 %
computed by Opulion: the stock exchange close against the same-day net asset value per share
Performance over time
Long termNo long-term series available for this company.
The share price
MarketThe share price, to read against the published net asset value above.
Getting to know Gimv
Each answer links to its source.
Who decides?
The board of directors, which brings together the chief executive, a majority of independents and directors put forward by WorxInvest, its reference shareholder, meaning the largest block of shares. A signed agreement between them frames their dialogue.
Sourcegimv.comWhat does it hold?
A portfolio of 59 companies, almost all unlisted, managed by sector: consumer, healthcare, industry, sustainable cities. On top sits a long-term pocket, "Anchor", carrying larger holdings such as the IT services firm Cegeka.
Sourcegimv.comHow does it choose its investments?
It starts from broad societal needs: sustainable food, the energy transition, digitalisation, health and ageing. It invests money from its own balance sheet and calls itself an "evergreen partner", free of a fund's limited lifespan.
Sourcegimv.comHow does it make money?
When its companies gain value: capital gains cashed in on sales, and the rise in value of those it keeps, re-estimated at each balance sheet date. Measured against the portfolio, that gain came to 18.8 % annualised last half-year, against a target of at least 17.5 %.
Sourcegimv.comHow are shareholders paid?
Through an annual dividend, 1.95 € per share for the last financial year, shortened to align it with the calendar year. The stated rule: never cut it, save in exceptional circumstances, and raise it sustainably whenever possible.
Sourcegimv.comWhat sets it apart
It runs rotation and long-term holding side by side: its sector platforms sell after a few years, while its "Anchor" pocket keeps its holdings with no exit date. For that pocket, it has teamed up with its reference shareholder, WorxInvest.
Sourcegimv.com
Who runs it, and since when?
Management and what it costs
- 27.1 M €
How long they have been there
Tenure on the board and in management
- Filip Dierckx· Chair of the Board of Directors, chair of the nomination committee2024
- Koen Dejonckheere· Director, Chief Executive Officer (CEO)2008
- Brigitte Boone· Director, member of the audit committee2015
- Johan Deschuyffeleer· Independent director, member of the nomination committee2018
- Manon Janssen· Independent director, member of the audit committee2017
- Rudy Provoost· Independent director2026
- Marc Valentiny· Director, member of the audit committee2024
- Robert Van Goethem· Director, member of the nomination committee2024
- Frank Verhaegen· Independent director, chair of the audit committee, member of the nomination committee2017
- An Vermeersch· Independent director, member of the nomination committee2017
- Hilde Windels· Independent director, member of the audit committee2022
- Kristof Vande Capelle· Chief Financial Officer (CFO), member of the Executive Committee2007
- Edmond Bastijns· Chief Legal Officer, member of the Executive Committee2000
- Koen Bouckaert· Member of the Executive Committeedate not published
- Bart Diels· Member of the Executive Committeedate not published
- Erik Mampaey· Member of the Executive Committeedate not published
- Bart Troubleyn· Member of the Executive Committee2025
- Tom Van de Voorde· Member of the Executive Committeedate not published
Company facts
Value and financial structure
- 1 643M €Market capitalisation, calculated by Opulion, at Jul 31, 2026 (not the reporting date of this page)
- 2 105M €Equity - group share, at Jun 30, 2026
- 227M €at Jun 30, 2026
- 57.20 €at Jun 30, 2026
- Founded in
- 1980
- Registered office
- Anvers, BE
- Headcount
- 95 the holding alone
- Headcount as at
- Dec 31, 2025 (not the reporting date of this page)
Tested against the figures
- −3.5 M €Jun 30, 2026
- Weight of the top ten holdings50.3 %Jun 30, 2026