Who is Investment AB Latour?
A Swedish investment company founded by the Douglas family, owning industrial groups and stakes in listed companies.
Value and financial structure
147 Bn SEK in gross assets11.5 % funded by borrowingthe share price 193.00 SEK against 203.00 SEK of net asset value per share, midpoint of the range (gap computed by Opulion between −10.2 % and +1.6 %)
What you own
Reporting date|Out of total assets of146 751 M SEK
By type
Listed or unlisted, and in what form.
Gross assets
147 Bn SEK
at Jun 30, 2026
Pick a part to see what it holds.
Inside: or . Outside: the type of asset.
What the company owes
11.5 %debt-financedat Jun 30, 2026
Net debt, after cash: 13 929 M SEK
Published loan to value, on net debt: 8.7 % as at Jun 30, 2026.
How this figure is calculated
It divides net debt, after cash, by the value of the assets, rather than gross borrowings by gross assets: that is why it differs from the share above.
These borrowings are the investment company's own — the ones its published bridge to net asset value deducts. They cover the same perimeter as the gross assets the chart divides, so the share above really does measure how much of those assets is debt-financed.
Source: Latour interim report january june 2026 · Aug 19, 2026
By theme
What the companies held do, in fifteen themes.
Sorted by theme
95 %
of gross assets
Pick a theme to see its companies.
As a share of gross assets, on the lines whose weight the company publishes. Themes defined by Opulion, the same on every page, not by the company.
Company by company
Names as published, as of Jun 30, 2026 unless another date is shown.
62 named holdings: 18 with a weight, 10 listed.
With their weight18
ventilation and air conditioning systems
12.0 %tools, clothing and equipment for tradespeople
10.4 %fastening and bolting solutions
6.9 %Nord-Lock Group companies
- Boltight100.0 % of capital
- Expander100.0 % of capital
- Nord-Lock100.0 % of capital
- Superbolt100.0 % of capital
- Energy Bolting
sensors and connected devices for buildings
5.7 %conveyors and parcel loading automation
4.5 %elevator and lifting platform group
4.5 %Innovalift companies
- Aritco100.0 % of capital
- Arkel100.0 % of capital
- BS Tableau100.0 % of capital
- Esse-Ti100.0 % of capital
- Gartec Group100.0 % of capital
- Motala Hissar100.0 % of capital
- TKS Heis100.0 % of capital
- Vega100.0 % of capital
- Vimec100.0 % of capital
- Tomra Systems
reverse vending and sorting machines for recycling
21.1 %of capital4.0 % carbon fiber fabrics
0.02 %carbon fiber loudspeaker diaphragms
0.00 %
6
home and building automation (KNX)
80.0 %of capitalhome and building automation (KNX)
80.0 %of capitalbuilding automation (KNX devices)
80.0 %of capitalKNX building automation devices (gateways, actuators, panels)
80.0 %of capitalhome and building automation
60.0 %of capitalbolt fastening and locking solutions
51.0 %of capital
5
compact forestry machines
100.0 %of capitalindustrial sealing for the process industry
100.0 %of capitalcutting tools for wood and metal
100.0 %of capitalautomated guided vehicles for intralogistics
100.0 %of capitalcomponents for power wheelchairs
100.0 %of capital
5
chemical-free water disinfection systems
real estate climate risk software for banks
compostable biomaterial alternative to plastic
mobile flood barriers
building electrical power management
The news feed
Up to date as of
Our latest articles on this company
The whole journalLatour moves to buy Bolt and Nut to expand Nord-Lock's critical fasteners business
The price is undisclosed. The deal shows how a targeted purchase could strengthen a highly profitable subsidiary while making only a modest difference to the holding company's debt.
Latour can invest SEK3 billion a year without crossing Fitch's red line
The A rating does more than describe debt quality. It quantifies the holding company's room to keep acquiring businesses inside its industrial subsidiaries, and the risk that could narrow it.
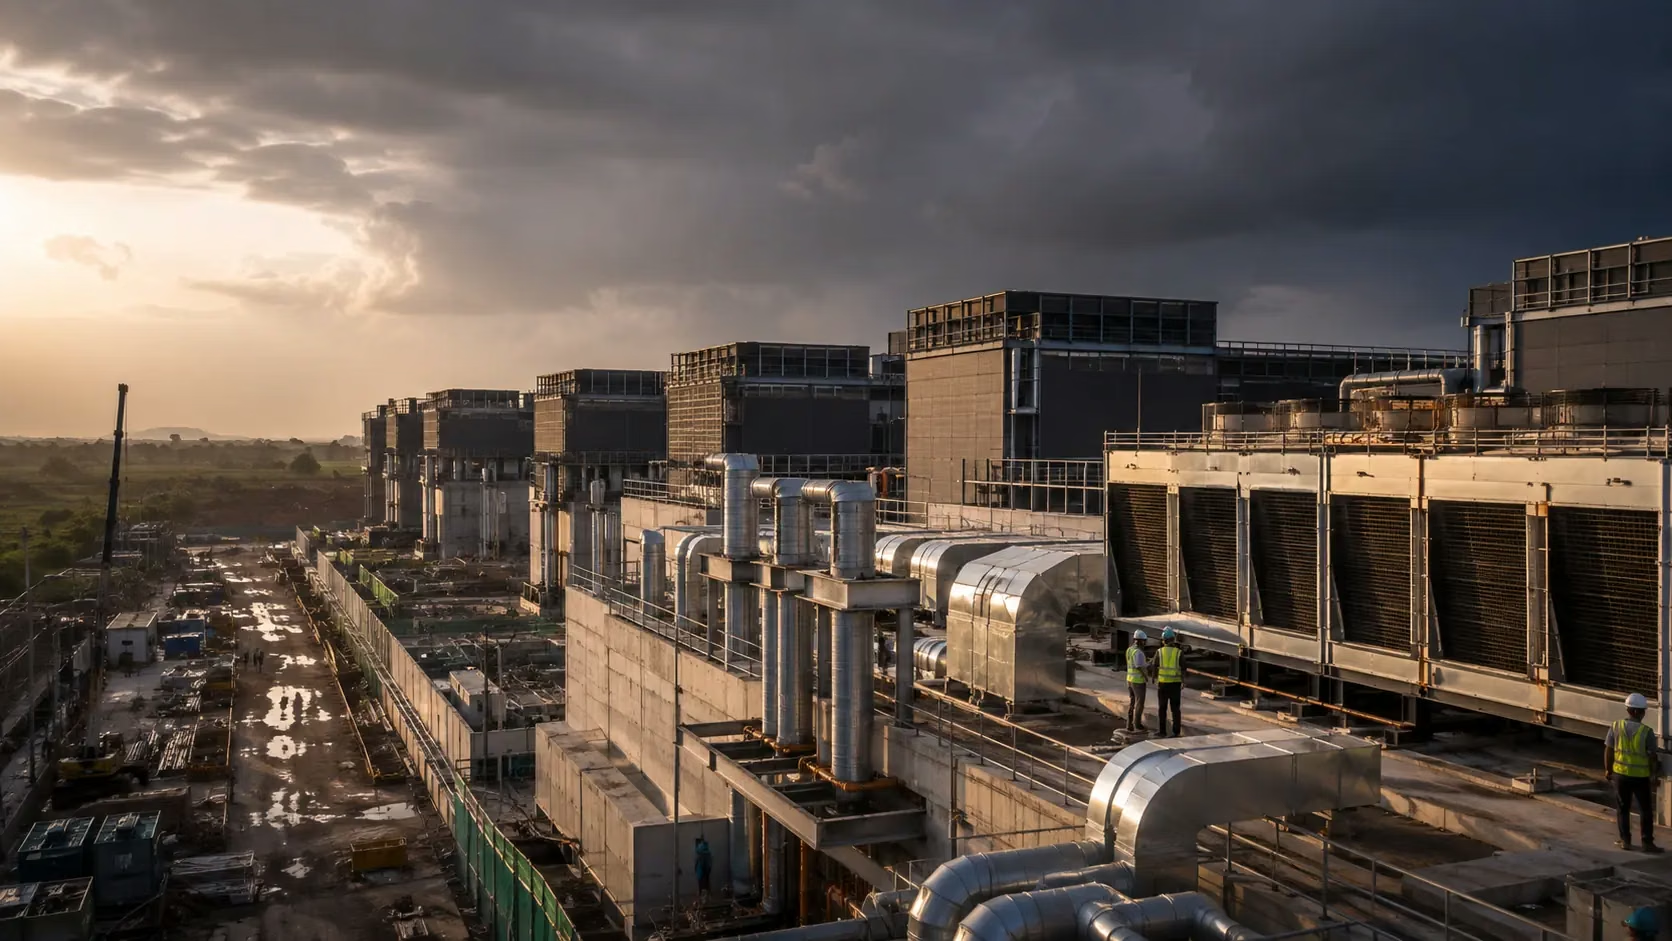
In India, Swegon adds 600 MW of substance to Latour's industrial strategy
The order does not yet quantify its contribution to profits. However, it demonstrates how Latour is opening a potential revenue stream from equipment, and subsequently from recurring services, within an asset it fully controls.


Upcoming publications
- Nov 3, 2026Interim reportInterim statement Q3 2026
- Feb 9, 2027Press releaseYear-end report 2026 (bokslutskommuniké)
- Mar 15, 2027Annual reportAnnual report 2026dated commitment by the issuer
- Apr 29, 2027Interim reportInterim statement Q1 2027
- May 13, 2027Annual general meetingAnnual general meeting
What it has returned
Reporting date
Against the same world benchmark for all.
Published performance,
World index in Swedish krona, SEK, per year
Company figures as of Dec 31, 2025 · world index as of Dec 31, 2025
1 year
- −16,9 %
- +2,2 %checked against 3 ETFs
5 years
- +4,1 %computed by Opulioncumulative +22,0 %
- +13,9 %checked against 3 ETFscumulative +91,9 %
Average return ; the follows below.
Method and sources
Each panel carries its own scale: lengths compare within a panel, never from one panel to the next.
A return is never converted from one currency to another: that would take the exchange rate move over the whole period, not the rate on one reporting date. The company's series are served in the issuer's currency only.
Every company covered is compared with the same benchmark, never with the index their own manager picked: a manager who picks his index also picks the bar he had to clear. This benchmark is not the MSCI ACWI itself, which belongs to MSCI and may not be redistributed. It is the median, recomputed by Opulion, of the net asset values published by three ETFs from three different managers tracking that index: iShares (IE00B6R52259), State Street SPDR (IE00B44Z5B48) and Amundi (LU1829220133). A single fund is never served on its own. Convention: last net asset value on a date at or before the reporting date, within a seven calendar day window; geometric annualisation over the nominal horizon; conversion at the European Central Bank reference rate of the day of the net asset value actually retained, a cross rate being an Opulion computation that is declared as such. The recomputation reproduces the performance each manager publishes for its own fund, to the second decimal, fifteen times out of twenty, and never departs from it by more than 0.04 point. Funds used: BlackRock, State Street and Amundi.
Converted at the reference rate of Jun 30, 2026, published by the European Central Bank. A cross rate is a computation, not a published figure: the ECB publishes rates against the euro only, and the other pairs are derived from two of them.
What is it worth on the market?
Reporting date
The share price against net asset value per share.
Values shown in Swedish krona, SEK
203.00 SEK
midpoint of the range, the company's calculation
Share price
193.00 SEK
price used by the company at this date
Price to net asset value gap
between −10.2 % and +1.6 %
computed by Opulion: the share price against both ends of the published net asset value per share
Performance over time
Long termFigures published by the company, over 5, 10 or 15 years, rebased to 100 at the start. Each point keeps its date and source; a missing year stays visible.
Rebased to 100 at the first year
Chart rendered with Lightweight Charts, created by TradingView
- MSCI ACWI world index, for market contextexact series34 published points out of 34
- Net asset value per share, excluding dividendsexact series12 published points out of 12
Method and limits
Series not shown
- Shareholder return, dividends reinvestedfewer than two published years
- Net asset value, total returndistributions incomplete over the period
- Investable benchmarkinvestable benchmark not yet legally available
View as a table
The same content as the figure, reachable by keyboard and without hovering.
| Year-end | Series | Index, base 100 | Published level | Source |
|---|---|---|---|---|
| Jun 30, 2023 | MSCI ACWI world index, for market context | 100.0 | 95.92 | Published by iShares, a fund tracking the index |
| Jul 31, 2023 | MSCI ACWI world index, for market context | 103.5 | 99.30 | Published by iShares, a fund tracking the index |
| Aug 31, 2023 | MSCI ACWI world index, for market context | 100.6 | 96.48 | Published by iShares, a fund tracking the index |
| Sep 29, 2023 | MSCI ACWI world index, for market context | 96.4 | 92.44 | Published by iShares, a fund tracking the index |
| Oct 31, 2023 | MSCI ACWI world index, for market context | 93.8 | 89.93 | Published by iShares, a fund tracking the index |
| Nov 30, 2023 | MSCI ACWI world index, for market context | 102.2 | 98.05 | Published by iShares, a fund tracking the index |
| Dec 29, 2023 | MSCI ACWI world index, for market context | 106.1 | 101.77 | Published by iShares, a fund tracking the index |
| Jan 31, 2024 | MSCI ACWI world index, for market context | 106.5 | 102.11 | Published by iShares, a fund tracking the index |
| Feb 29, 2024 | MSCI ACWI world index, for market context | 111.3 | 106.76 | Published by iShares, a fund tracking the index |
| Mar 31, 2024 | MSCI ACWI world index, for market context | 114.8 | 110.12 | Published by iShares, a fund tracking the index |
| Apr 30, 2024 | MSCI ACWI world index, for market context | 110.8 | 106.24 | Published by iShares, a fund tracking the index |
| May 31, 2024 | MSCI ACWI world index, for market context | 115.7 | 111.01 | Published by iShares, a fund tracking the index |
| Jun 28, 2024 | MSCI ACWI world index, for market context | 117.1 | 112.31 | Published by iShares, a fund tracking the index |
| Jul 31, 2024 | MSCI ACWI world index, for market context | 119.0 | 114.16 | Published by iShares, a fund tracking the index |
| Aug 30, 2024 | MSCI ACWI world index, for market context | 122.0 | 117.05 | Published by iShares, a fund tracking the index |
| Sep 30, 2024 | MSCI ACWI world index, for market context | 124.7 | 119.61 | Published by iShares, a fund tracking the index |
| Oct 31, 2024 | MSCI ACWI world index, for market context | 122.0 | 117.01 | Published by iShares, a fund tracking the index |
| Nov 29, 2024 | MSCI ACWI world index, for market context | 126.8 | 121.62 | Published by iShares, a fund tracking the index |
| Dec 31, 2024 | MSCI ACWI world index, for market context | 122.4 | 117.45 | Published by iShares, a fund tracking the index |
| Jan 31, 2025 | MSCI ACWI world index, for market context | 126.5 | 121.31 | Published by iShares, a fund tracking the index |
| Feb 28, 2025 | MSCI ACWI world index, for market context | 126.0 | 120.88 | Published by iShares, a fund tracking the index |
| Mar 31, 2025 | MSCI ACWI world index, for market context | 121.2 | 116.28 | Published by iShares, a fund tracking the index |
| Apr 30, 2025 | MSCI ACWI world index, for market context | 122.1 | 117.16 | Published by iShares, a fund tracking the index |
| May 30, 2025 | MSCI ACWI world index, for market context | 129.1 | 123.86 | Published by iShares, a fund tracking the index |
| Jun 30, 2025 | MSCI ACWI world index, for market context | 134.1 | 128.62 | Published by iShares, a fund tracking the index |
| Jul 31, 2025 | MSCI ACWI world index, for market context | 135.5 | 129.93 | Published by iShares, a fund tracking the index |
| Aug 29, 2025 | MSCI ACWI world index, for market context | 139.1 | 133.41 | Published by iShares, a fund tracking the index |
| Sep 30, 2025 | MSCI ACWI world index, for market context | 144.2 | 138.36 | Published by iShares, a fund tracking the index |
| Oct 31, 2025 | MSCI ACWI world index, for market context | 147.3 | 141.31 | Published by iShares, a fund tracking the index |
| Nov 28, 2025 | MSCI ACWI world index, for market context | 147.4 | 141.37 | Published by iShares, a fund tracking the index |
| Dec 31, 2025 | MSCI ACWI world index, for market context | 147.5 | 141.45 | Published by iShares, a fund tracking the index |
| Jan 30, 2026 | MSCI ACWI world index, for market context | 151.7 | 145.47 | Published by iShares, a fund tracking the index |
| Feb 27, 2026 | MSCI ACWI world index, for market context | 153.7 | 147.41 | Published by iShares, a fund tracking the index |
| Mar 31, 2026 | MSCI ACWI world index, for market context | 144.0 | 138.13 | Published by iShares, a fund tracking the index |
| Jun 30, 2023 | Net asset value per share, excluding dividends | 100.0 | 193.00 | Published by the company |
| Sep 30, 2023 | Net asset value per share, excluding dividends | 89.1 | 172.00 | Published by the company |
| Dec 31, 2023 | Net asset value per share, excluding dividends | 102.6 | 198.00 | Published by the company |
| Mar 31, 2024 | Net asset value per share, excluding dividends | 105.7 | 204.00 | Published by the company |
| Jun 30, 2024 | Net asset value per share, excluding dividends | 102.6 | 198.00 | Published by the company |
| Sep 30, 2024 | Net asset value per share, excluding dividends | 111.9 | 216.00 | Published by the company |
| Dec 31, 2024 | Net asset value per share, excluding dividends | 111.4 | 215.00 | Published by the company |
| Mar 31, 2025 | Net asset value per share, excluding dividends | 110.4 | 213.00 | Published by the company |
| Jun 30, 2025 | Net asset value per share, excluding dividends | 107.3 | 207.00 | Published by the company |
| Sep 30, 2025 | Net asset value per share, excluding dividends | 108.8 | 210.00 | Published by the company |
| Dec 31, 2025 | Net asset value per share, excluding dividends | 111.9 | 216.00 | Published by the company |
| Mar 31, 2026 | Net asset value per share, excluding dividends | 105.2 | 203.00 | Published by the company |
Cases covered
- Share splits and reverse splitsnot yet covered
- Special dividendshandled
- Distributions in sharesnot yet covered
- Subscription rightsnot yet covered
- Share buybacks and cancellationshandled
- Spin-offsnot yet covered
- Change of listing currencyexcluded
- Change of share classnot yet covered
- Change in the share count used as denominatorhandled
- Withholding tax, fees, gross versus netexcluded
Series source: Latour, net asset value published quarterly since Q2 2023
Latest reporting date: Mar 31, 2026.
The share price
MarketThe share price, to read against the published net asset value above.
Getting to know Latour
Each answer links to its source.
Who decides?
The Douglas family, directly and through its companies: it holds 76.1 % of the capital and 79.3 % of the votes. Eric and Carl Douglas, its main holders, sit on the board of directors.
Sourcelatour.seWhat does it own?
Two blocks. Wholly owned industrial groups such as Swegon and Nord-Lock, valued at 67 179 M SEK on its mid-point estimate; and stakes in listed companies where it is the largest or one of the largest shareholders, led by Assa Abloy, worth 74 464 M SEK.
Sourcelatour.seHow does it choose its investments?
It looks for businesses that design and make their own products under their own brands, in a profitably growing industry, with room to expand abroad. In its own words, the "next wave of development" must also have begun.
Sourcelatour.seHow does it make money?
As an industrial group as much as an investor. Its subsidiaries sold 13 961 M SEK over the last half-year, with an operating margin, the share of sales left after running costs, of 13.5 %. Its listed holdings pay it dividends.
Sourcelatour.seHow are shareholders paid?
Through a dividend set by a rule: the company passes on all the dividends it receives from its holdings, plus a share of its subsidiaries' after-tax profit. For the last financial year, 5.10 SEK per share; share buybacks are occasional.
Sourcelatour.seWhat sets it apart
It publishes its net asset value, what it owns after debt, as a range: from 190 SEK to 215 SEK per share. With no share price for its subsidiaries, it multiplies their operating profit by a range of ratios taken from comparable listed firms.
Sourcelatour.se
Who runs it, and since when?
Management and what it costs
- −18 M SEK
- 0.1 %
Who controls the capital
- Controlling shareholder's capital
- 76.1 %
- Controlling shareholder's voting rights
- 79.3 %
How long they have been there
Tenure on the board and in management
- Johan Nordström· Chair of the Board2024
- Johan Hjertonsson· Director, Chief Executive Officer (CEO)2019
- Anders Böös· Director2005
- Mariana Burenstam Linder· Director2011
- Carl Douglas· Director2008
- Eric Douglas· Director2002
- Lena Olving· Director2016
- Hélène Barnekow· Director2025
- Mikael J. Albrektsson· Chief Financial Officer (CFO)2025
- Andreas Örje Wellstam· Chief Investment Officer (CIO)2026
- Heléne Mellquist· Chief Operating Officer (COO)date not published
Company facts
Value and financial structure
- 123 388M SEKMarket capitalisation, at Jun 30, 2026, calculated by Opulion
- 43 788M SEKCapital and reserves attributable to parent company shareholders, at Jun 30, 2026
- 13 929M SEKat Jun 30, 2026
- 203.00 SEKat Jun 30, 2026
- Founded in
- 1985
- Registered office
- Göteborg, SE
Tested against the figures
- 0.1 %Dec 31, 2025 (not the reporting date of this page)
- 2.3 %Dec 31, 2025 (not the reporting date of this page)