Ackermans & van Haaren NV
Who is Ackermans & van Haaren NV?
An independent Antwerp investment group, listed in Brussels, investing long term in a few companies and sitting on their boards.
Value and financial structure
5.9 Bn € of published shareholders' equity524 M € of holding company net cashthe share price 285.80 € against 180.58 € of shareholders' equity per share (book value)
What you own
Reporting date|Out of total assets of5 898 M €
By type
Listed or unlisted, and in what form.
Published equity
5.9 Bn €
at Jun 30, 2026
Pick a part to see what it holds.
Inside: or . Outside: the type of asset.
What the company owes
524 M €of holding company net cashat Jun 30, 2026
Consolidated group borrowings: 1 902 M €.
How this figure is calculated
These borrowings are the consolidated group's, carried mostly by operating subsidiaries rather than by the investment company. They do not cover the same perimeter as the gross assets the chart divides, so no share is computed here: dividing one by the other would compare two different things.
Source: Ackermans van haaren half-year report 2026 · Aug 28, 2026
By theme
What the companies held do, in fifteen themes.
Named holdings
34
sorted into 10 themes
Pick a theme to see its companies.
By number of companies: the company does not publish the weight of each line, so the ring counts names, not amounts. Themes defined by Opulion, the same on every page, not by the company. The 6 funds held are counted separately: a fund is not a line of business.
Company by company
Names as published, as of Jun 30, 2026 unless another date is shown.
44 named holdings: none with a weight, 7 listed. 1 is also held by another company followed on Opulion.
8
industrial zones and business parks in Vietnam
81.27 %of capital- Green Offshore
stakes in Belgian offshore wind farms
81.27 %of capital construction, multi-technical services and property development
62.54 %of capitaldredging, marine works and offshore wind
62.12 %of capitaldevelopment and operation of Belgian offshore wind farms
10.13 %of capital- Otary RS
offshore wind farms (Belgium)
10.13 %of capital - Rentel
- SeaMade
3
bank for entrepreneurs and independent professionals
78.75 %of capitalprivate banking and wealth management
78.75 %of capital- 39.38 %of capital
1
Belgian property investor and developer
69.28 %of capital
3
oil palm, tea and banana plantations
43.32 %of capitalhigh-yield oil palm seeds
42.0 %of capitalcement production in India
19.64 %of capital
13
- Agidens International
- Biolectric Group
- Amsteldijk Beheer
- Turbo's Hoet Groep
- Blue Real Estate
- V.Group
- Van Moer Group
- Financière EMG (Gravity Media)
- OM Partners
- BSTOR
- VKC Nuts
- Mediahuis
- Camlin Fine Sciences
9
- Bio Cap Invest (Epics Therapeutics)
- Biotalys
- MRM Health
- Disco Pharmaceuticals
- Vico Therapeutics International
- OncoDNA
- AstriVax
- Confo Therapeutics
- Indigo Diabetes
7
- HealthQuad Fund I
- Venturi Fund II
- Venturi Fund I
- HealthQuad Fund II
- Venturi Partners / Venturi I Capital
- Medikabazaar (direct)
- Convergent Finance
Legal structure · 7 entities
Intermediate holding companies and holding vehicles. They are not investments: they are not counted in the names above.
Group holding entities
Anfima · AvH Growth Capital · Brinvest · FinAx · Oksalys · Profimolux
Sub-holdings and vehicles
GreenStor
What is it worth on the market?
Reporting date
The share price against net asset value per share.
Values shown in euro, EUR
180.58 €
book value published by the company, which publishes no net asset value
Share price
285.80 €
price used by the company at this date
The issuer does not publish a discount
Performance over time
Long termFigures published by the company, over 5, 10 or 15 years, rebased to 100 at the start. Each point keeps its date and source; a missing year stays visible.
Rebased to 100 at the first year
Chart rendered with Lightweight Charts, created by TradingView
- Shareholder return, dividends reinvestedannual approximation10 published points out of 10
- MSCI ACWI world index, for market contextexact series114 published points out of 114
- Shareholders' equity, total return, book valueannual approximation11 published points out of 11
Method and limits
Method: distributions within a calendar year are added up and reinvested at the 31 December closing price. With no ex-dates or intra-year prices available, the result is an annual approximation.
Series not shown
- Investable benchmarkinvestable benchmark not yet legally available
View as a table
The same content as the figure, reachable by keyboard and without hovering.
| Year-end | Series | Index, base 100 | Published level | Source |
|---|
Cases covered
- Share splits and reverse splitsnot yet covered
- Special dividendshandled
- Distributions in sharesnot yet covered
- Subscription rightsnot yet covered
- Share buybacks and cancellationshandled
- Spin-offsnot yet covered
- Change of listing currencyexcluded
- Change of share classnot yet covered
- Change in the share count used as denominatorhandled
- Withholding tax, fees, gross versus netexcluded
Series source: Key Figures 2025 d'Ackermans & van Haaren (tableau « Data per share »), rapport annuel 2025 et rapport semestriel 2026
Latest reporting date: Jun 30, 2026.
The share price
MarketThe share price, to read against the published shareholders' equity per share above: a book value, not a net asset value.
What it has returned
Reporting date
Against the same world benchmark for all.
Published performance,
World index in euro, EUR, per year
Company figures as of Dec 31, 2025 · world index as of Dec 31, 2025
5 years
- +15.0 %
- +12.2 %checked against 3 ETFscumulative +77.9 %
Average return ; the follows below.
Method and sources
Each panel carries its own scale: lengths compare within a panel, never from one panel to the next.
A return is never converted from one currency to another: that would take the exchange rate move over the whole period, not the rate on one reporting date. The company's series are served in the issuer's currency only.
Every company covered is compared with the same benchmark, never with the index their own manager picked: a manager who picks his index also picks the bar he had to clear. This benchmark is not the MSCI ACWI itself, which belongs to MSCI and may not be redistributed. It is the median, recomputed by Opulion, of the net asset values published by three ETFs from three different managers tracking that index: iShares (IE00B6R52259), State Street SPDR (IE00B44Z5B48) and Amundi (LU1829220133). A single fund is never served on its own. Convention: last net asset value on a date at or before the reporting date, within a seven calendar day window; geometric annualisation over the nominal horizon; conversion at the European Central Bank reference rate of the day of the net asset value actually retained, a cross rate being an Opulion computation that is declared as such. The recomputation reproduces the performance each manager publishes for its own fund, to the second decimal, fifteen times out of twenty, and never departs from it by more than 0.04 point. Funds used: BlackRock, State Street and Amundi.
Converted at the reference rate of Jun 30, 2026, published by the European Central Bank.
The news feed
Up to date as of
Our latest articles on this company
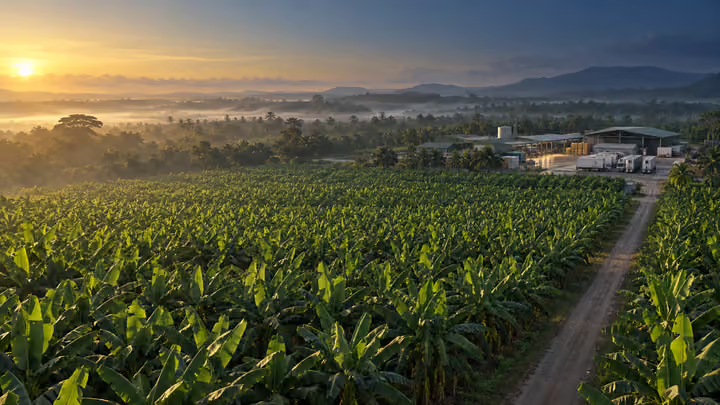
The whole journalSIPEF targets 70,000 tonnes of bananas: what Tiabam changes for Ackermans & van Haaren
The acquisition potentially adds 12,000 to 14,000 tonnes to a business that remains small within SIPEF. More importantly, it arrives as AvH turns its long-standing stake into the foundation of a broader Food & Agri platform.
Delen opens Zurich: the small office that tells the story of AvH's big engine
Behind yet another address lies the strategy of a 78.75% stake that has become both the largest contributor to the H1 2026 results and the main cash provider for the Belgian holding company.
Behind EUR 340m of profit, a capital machine
DEME and private banking produce almost all of Ackermans & van Haaren's earnings. But they do not play the same role: Delen releases a great deal of capital, DEME reinvests it heavily. Between the two, the holding company builds up a firepower that explains its model better than any org chart.

Upcoming publications
- Dec 1, 2026Interim reportInterim statement Q3 2026
- Feb 26, 2027Annual reportAnnual results 2026
- Mar 31, 2027Annual reportAnnual report 2026
- May 20, 2027Interim reportInterim statement Q1 2027
- May 24, 2027Annual general meetingAnnual general meeting
- Aug 30, 2027Half-year reportHalf-year results 2027
- Nov 25, 2027Interim reportInterim statement Q3 2027
Getting to know Ackermans & van Haaren
Each answer links to its source.
Who decides?
A chain of companies. Scaldis Invest holds 33.3 % of the capital; it is controlled by Belfimas, the reference shareholder, and at the top of the chain sits a Dutch-law foundation, "Het Torentje". Two AvH directors sit on the Belfimas board.
Source of card 1: avh.be, opens in a new tabWhat does it own?
Five poles. Marine engineering, DEME and CFE, from dredging to renewable energy, carries 1 878 M € of equity, their value on its balance sheet; private banking, Delen and Bank Van Breda, 1 806 M €. Then come real estate, tropical agriculture and growth capital.
Source of card 2: avh.be, opens in a new tabHow does it choose its investments?
It teams up with families, co-shareholders and managers, and sets strategic goals with each holding. It strives for "annual recurring growth of the results of each participation", not quick dividends.
Source of card 3: avh.be, opens in a new tabHow does it make money?
Its profit is, for the most part, its share of its holdings' results, 340 M € over the last half-year. Cash, for its part, comes up as dividends: 283 M € received over the same period, mostly paid by its two private banks, Delen and Bank Van Breda.
Source of card 4: ml-eu.globenewswire.com, opens in a new tabHow are shareholders paid?
Through a dividend, 4.60 € gross per share for the last financial year, which the company aims to grow over time. Its purchases of own shares serve a liquidity contract, which keeps the stock trading, and cover a stock option plan.
Source of card 5: avh.be, opens in a new tabWhat sets it apart
It does not publish a revalued net asset value, the market value of what it owns. It brings its holdings into its own accounts and measures itself by the growth of its equity, dividends included: 12.7 % a year on average since its stock market listing.
Source of card 6: avh.be, opens in a new tab
Who runs it, and since when?
Management and what it costs
- Not published at this reporting date
Who controls the capital
- Controlling shareholder's capital
- 33.3 %
- Controlling shareholder's voting rights
- 33.3 %
- Free float
- Not published at this reporting date
How long they have been there
Tenure on the board and in management
- Luc Bertrand· Chair of the Board of Directors, non-executive director1985
- Sonali Chandmal· Independent director2023
- Marion Debruyne· Independent director, member of the audit committee2016
- Bart Deckers· Independent director, member of the remuneration committee2022
- Jacques Delen· Non-executive director1992
- Deborah Janssens· Non-executive director2023
- Frank van Lierde· Independent director, member of the audit committee2023
- Julien Pestiaux· Non-executive director, chair of the audit committee, member of the remuneration committee2011
- Thierry van Baren· Non-executive director2006
- Victoria Vandeputte· Independent director, chair of the remuneration committee2018
- Frederic van Haaren· Non-executive director1993
- Pierre Willaert· Non-executive director1998
- John-Eric Bertrand· Co-CEO, co-chair of the Executive Committee2008
- Piet Dejonghe· Co-CEO, co-chair of the Executive Committee1995
- Tom Bamelis· Chief Financial Officer (CFO), member of the Executive Committee1999
- Piet Bevernage· Secrétaire général, membre du comité de direction1995
- André-Xavier Cooreman· Member of the Executive Committeedate not published
- An Herremans· Member of the Executive Committee2014
- Koen Janssen· Member of the Executive Committee2001
Company facts
Value and financial structure
- 9 476M €Market capitalisation, at Jun 30, 2026
- 5 898M €at Jun 30, 2026
- 524M €at Jun 30, 2026
- Not published at this reporting dateat Jun 30, 2026
- Assets under management
- 84 166M €Delen Private Bank, at Jun 30, 2026
- Founded in
- 1876
- Registered office
- Anvers, BE
- Headcount
- 52 the holding alone
- Headcount as at
- Dec 31, 2025 (not the reporting date of this page)
Tested against the figures
- 1.6 %Jun 30, 2026
Build a portfolio with Ackermans & van Haaren NV
Add it to a private portfolio and see what you own, company by company. Free, no password.
Add to a portfolio