Sofina SA
Who is Sofina SA?
A Brussels-listed investment company, backed by a family, that puts patient capital into companies and funds.
Value and financial structure
12.9 Bn € in gross assets10.1 % funded by borrowingthe share price 222.60 € against 326.48 € of net asset value per share (published discount 32.0 %)
What you own
Reporting date|Out of total assets of12 911 M €
By type
Listed or unlisted, and in what form.
Gross assets
12.9 Bn €
at Jun 30, 2026
Pick a part to see what it holds.
Inside: or . Outside: the type of asset.
What the company owes
10.1 %debt-financedat Jun 30, 2026
Net debt, after cash: 219 M €
Published loan to value, on net debt: 1.9 % as at Jun 30, 2026.
Uncalled commitments to its funds: 1 456 M € as at Jun 30, 2026.
How this figure is calculated
Uncalled commitments are not borrowings: they are amounts the company has promised to its funds, which the funds draw as they invest. They are therefore not counted in the share financed by borrowing.
It divides net debt, after cash, by the value of the assets, rather than gross borrowings by gross assets: that is why it differs from the share above.
These borrowings are the investment company's own — the ones its published bridge to net asset value deducts. They cover the same perimeter as the gross assets the chart divides, so the share above really does measure how much of those assets is debt-financed.
Source: Sofina half year report 2026 · Sep 2, 2026
By theme
What the companies held do, in fifteen themes.
Named holdings
73
sorted into 12 themes
Pick a theme to see its companies.
By number of companies: the company does not publish the weight of each line, so the ring counts names, not amounts. Themes defined by Opulion, the same on every page, not by the company. The 55 funds held are counted separately: a fund is not a line of business.
The breakdown published by the company
By sector · Jun 30, 2026
- Digital transformation
- 36.0 %
- Consumer and retail
- 27.0 %
- Education
- 12.0 %
- Healthcare and life sciences
- 12.0 %
- Other
- 9.0 %
- Sustainable supply chains
- 4.0 %
Company by company
Names as published, as of Jun 30, 2026 unless another date is shown.
131 named holdings: none with a weight, 4 listed. 4 are also held by another company followed on Opulion.
76
natural cosmetics
49.0 %of capitaldisposable diapers and hygiene products
25.0 %of capitalmaterials and electrolytes for lithium-ion batteries
23.37 %of capitalinstitutional investment consulting
21.4 %of capital- Dott
shared electric scooters and bikes
20.37 %of capital - Creature Comforts
network of veterinary clinics in the UK
20.29 %of capital - Hector Beverages
- Eye Security
- Proeduca
- Birdie
- MedGenome
- Mérieux NutriSciences
- Vivobarefoot
- Chapoutier
- Primer
- Cognita
- Qargo
- EG Software
- K12 Techno Services
- Salto Systems
- BioFirst
- The Whole Truth
- DeHaat
- Cleo AI
- Stream
- Berry Street
- Everdrop
- Cerealis
- Skillmatics
- Oviva
- Ji Xiang Ju
- Petkit
- Rohlik
- FirstClub
- Scalable Capital
- opseo Intensivpflege
- THG
- Finova Capital
- Veepee
- VerSe Innovation
- Luxempart
- Typeform
- Xinyu
- Laifen
- Twin Health
- team.blue
- Carebridge
- ACT
- Zencore Biologics
- Talkiatry
- Vinted
- Moody
- Collibra
- XBOW
- HSG Alliance D
- ThoughtSpot
- CRED
- Too Good To Go
- Pine Labs
- Zhuoyu Technology
- Included Health
- PostHog
- bioMérieux
- Cyera
- Lenskart
- Supabase
- Iconiq Strategic Partners III Co-Invest (Series RV)
- Mistral AI
- ByteDance
- CoachHub
- Hypershell
- Kopi Kenangan
- Labster
- Lyskraft
- ReeToo
- Vizgen
55
venture and growth capital fund
generalist venture capital fund
- Archipelago
alternative investment fund (Ares)
- Ascendent
private equity manager in Asia
seed-stage venture capital fund in Berlin
- Atomico
- Bain
- Battery
- Bessemer
- Bling
- Blossom
- Bond
- Chryscapital
- Draper Fisher Jurvetson
- DST
- Felix
- Formation 8
- Foundry
- Francisco
- General Atlantic
- General Catalyst
- Genesis
- Highland
- HongShan
- Iconiq Capital
- Insight Partners
- Institutional Venture Partners
- InvAscent
- Kedaara
- Kleiner Perkins
- Lightspeed
- Lux Capital
- Lyfe
- Multiples
- New Enterprise Associates
- Northzone
- OpenView
- Peak XV
- Phoenix Court
- Polychain
- Redpoint
- Ribbit
- Sequoia Capital
- Singular
- Source Code
- Spark
- Summit
- TA Associates
- The Founders Fund
- Thoma Bravo
- Thrive Capital
- Tiger Global
- Trustbridge
- Venrock
What is it worth on the market?
Reporting date
The share price against net asset value per share.
Values shown in euro, EUR
326.48 €
the company's calculation
Share price
222.60 €
price used by the company at this date
32.0 %
the company's own figure, not recomputed; the direction is the price against the same-date net asset value
Performance over time
Long termFigures published by the company, over 5, 10 or 15 years, rebased to 100 at the start. Each point keeps its date and source; a missing year stays visible.
Rebased to 100 at the first year
Chart rendered with Lightweight Charts, created by TradingView
- Share price, excluding dividendsexact series16 published points out of 16
- MSCI ACWI world index, for market contextexact series181 published points out of 181
- Net asset value per share, excluding dividendsexact series16 published points out of 16
Method and limits
Series not shown
- Shareholder return, dividends reinvesteddistributions incomplete over the periodmissing payments: 2011, 2012, 2013, 2014, 2015 (financial years 2010, 2011, 2012, 2013, 2014)
- Net asset value, total returndistributions incomplete over the periodmissing payments: 2011, 2012, 2013, 2014, 2015 (financial years 2010, 2011, 2012, 2013, 2014)
- Investable benchmarkinvestable benchmark not yet legally available
View as a table
The same content as the figure, reachable by keyboard and without hovering.
| Year-end | Series | Index, base 100 | Published level | Source |
|---|
Cases covered
- Share splits and reverse splitsnot yet covered
- Special dividendshandled
- Distributions in sharesnot yet covered
- Subscription rightsnot yet covered
- Share buybacks and cancellationshandled
- Spin-offsnot yet covered
- Change of listing currencyexcluded
- Change of share classnot yet covered
- Change in the share count used as denominatorhandled
- Withholding tax, fees, gross versus netexcluded
Series source: Sofina “Key figures” page, read on 09/08/2026
Latest reporting date: Dec 31, 2025.
The share price
MarketThe share price, to read against the published net asset value above.
What it has returned
Reporting date
Against the same world benchmark for all.
Published performance,
World index in euro, EUR, per year
Company figures as of Dec 31, 2025 · world index as of Dec 31, 2025
1 year
- −0.8 %
- +8.2 %checked against 3 ETFs
3 years
- +4.2 %
- +16.9 %checked against 3 ETFscumulative +59.5 %
5 years
- +4.1 %
- +12.2 %checked against 3 ETFscumulative +77.9 %
10 years
- +8.4 %
- +10.8 %checked against 3 ETFscumulative +179.4 %
Average return ; the follows below.
Method and sources
Each panel carries its own scale: lengths compare within a panel, never from one panel to the next.
A return is never converted from one currency to another: that would take the exchange rate move over the whole period, not the rate on one reporting date. The company's series are served in the issuer's currency only.
Every company covered is compared with the same benchmark, never with the index their own manager picked: a manager who picks his index also picks the bar he had to clear. This benchmark is not the MSCI ACWI itself, which belongs to MSCI and may not be redistributed. It is the median, recomputed by Opulion, of the net asset values published by three ETFs from three different managers tracking that index: iShares (IE00B6R52259), State Street SPDR (IE00B44Z5B48) and Amundi (LU1829220133). A single fund is never served on its own. Convention: last net asset value on a date at or before the reporting date, within a seven calendar day window; geometric annualisation over the nominal horizon; conversion at the European Central Bank reference rate of the day of the net asset value actually retained, a cross rate being an Opulion computation that is declared as such. The recomputation reproduces the performance each manager publishes for its own fund, to the second decimal, fifteen times out of twenty, and never departs from it by more than 0.04 point. Funds used: BlackRock, State Street and Amundi.
Converted at the reference rate of Jun 30, 2026, published by the European Central Bank.
The news feed
Up to date as of
Our latest articles on this company
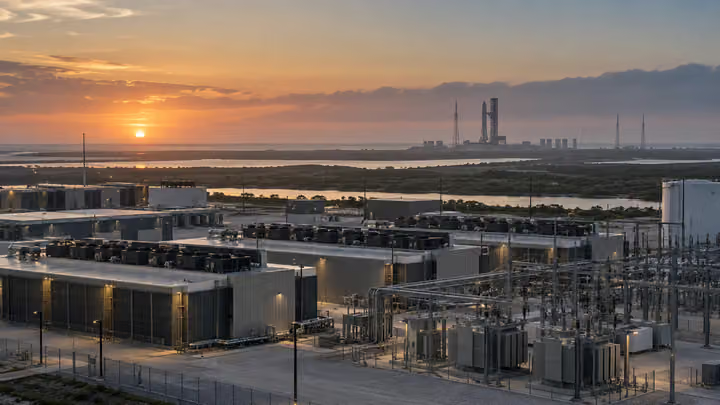
The whole journalSpaceX adds USD1.11 billion a month of hosted compute: what it means for three listed holdings
The new contract does more than change SpaceX's revenue mix. It asks Scottish Mortgage, US Growth and Sofina shareholders to look beyond rockets and Starlink.
Anthropic and Accenture commit at least USD2 billion to testing AI from the inside
An external evaluator will be able to observe model design and deployment. For three listed holdings exposed to Anthropic, the test is whether that access becomes real oversight or merely another compliance cost.
ByteDance tops $120 billion of half-year revenue: why it matters to Scottish Mortgage, Sofina and SoftBank
TikTok is accelerating, but artificial intelligence is squeezing profit. Three listed investment companies reach ByteDance through three very different routes.


Upcoming publications
- Jan 20, 2027Press releaseNewsletter no. 19
- Mar 24, 2027Annual reportAnnual report 2026, as at 31/12/2026
- May 13, 2027Annual general meetingAnnual general meeting 2027, 15:00
- Jul 22, 2027Press releaseNewsletter no. 20
- Sep 2, 2027Half-year reportHalf-year report 2027, as at 30/06/2027
Getting to know Sofina
Each answer links to its source.
Who decides?
Three companies led by Union Financière Boël, bound by a concert agreement, meaning they vote together. They hold 54.6 % of the capital, more than half: no general meeting resolution passes without them.
Source of card 1: sofinagroup.com, opens in a new tabWhat does it own?
Two pockets of similar size, almost entirely unlisted. Directly, 5 862 M € of stakes, including ByteDance, the Chinese internet group and its largest position, and the Cognita private school network. Then 5 969 M € in venture capital funds run by third parties.
Source of card 2: sofinagroup.com, opens in a new tabHow does it choose its investments?
It stays a minority shareholder and usually seeks a board seat. It looks for a proven business model, "a closely held and aligned shareholder base" and founders still at work. Its permanent capital, with no maturity date, lets it hold for a long time.
Source of card 3: sofinagroup.com, opens in a new tabHow does it make money?
When its holdings grow in value. Its portfolio is revalued every six months at fair value, the price a buyer would pay: up 8.1 % over the last half-year. The gain is cashed in on a sale, as with Salto, whose disposal has been signed.
Source of card 4: sofinagroup.com, opens in a new tabHow are shareholders paid?
Through a dividend, 3.66 € gross per share for the last financial year, which the company describes as stable and regularly raised for decades. Its share buyback programmes serve to cover the stock options granted to its staff.
Source of card 5: sofinagroup.com, opens in a new tabWhat sets it apart
It also invests as a fund subscriber: since the late seventies, it has entrusted money to venture capital funds run by other managers. This lasting tie lets it co-invest, taking direct stakes alongside those managers in the companies their funds back.
Source of card 6: sofinagroup.com, opens in a new tab
Who runs it, and since when?
Management and what it costs
- −35.8 M €
- Not published at this reporting date
Who controls the capital
- Controlling shareholder's capital
- 54.6 %
How long they have been there
Tenure on the board and in management
- Charlotte Strömberg· Chair of the Board2026
- Catherine Soubie· Vice Chair of the Board2026
- Harold Boël· Director, Chief Executive Officer (CEO)2004
- Laura Cioli· Independent director2018
- Laurent de Meeûs d'Argenteuil· Director2015
- Felix Goblet d'Alviella· Director2023
- Anja Langenbucher· Independent director2018
- Charles Peugeot· Independent director2026
- Michèle Sioen· Independent director2016
- Leslie Teo· Independent director2023
- Union Financière Boël SA· Director2026
- Rajeev Vasudeva· Independent director2023
- Gwill York· Independent director2018
- Dominique Lancksweert· Honorary President2026
- Xavier Coirbay· Member of the Leadership Council2024
- Amélie Lagache· Member of the Leadership Council2024
- Maxence Tombeur· Member of the Leadership Council2024
- Edward Koopman· Member of the Leadership Council2024
- Giulia Van Waeyenberge· Member of the Leadership Council2024
Company facts
Value and financial structure
- 7 864M €Market capitalisation, at Jun 30, 2026, calculated by Opulion
- 11 534M €group's share, at Jun 30, 2026
- 219M €at Jun 30, 2026
- 326.48 €at Jun 30, 2026
- Founded in
- 1898
- Registered office
- Bruxelles, BE
- Headcount
- 83 the holding alone
- Headcount as at
- Dec 31, 2025 (not the reporting date of this page)
Tested against the figures
- 1.6 %Jun 30, 2026
- 51.3 M €Jun 30, 2026
- Weight of the top ten holdings27 %Jun 30, 2026
Build a portfolio with Sofina SA
Add it to a private portfolio and see what you own, company by company. Free, no password.
Add to a portfolio