News · Brederode S.A.
Brederode: the market leaves just 43 cents for each euro of private equity
Asset values rise while the share price falls. Behind the discount lies a simple question: when will private fund values turn into available cash?
A holding company can own valuable businesses while its share price falls. Understanding that gap means looking at what it owns and how long it will take to turn those investments back into cash.
Brederode offers a striking example. On 1 October, its shares closed at €100 against a net asset value of €154.64 reported for 30 June. Net asset value adds up investments and other assets, then subtracts liabilities. The market is therefore paying about €65 for every €100 of reported value.
Where does the €35 gap sit? Once we value the listed shares at current prices, our calculation leaves just 43 cents for each euro of private funds recorded in the accounts. That puts a number on the doubt. To explore possible explanations, we need to follow the timing of cash, acquisition prices and funding needs.
Two portfolios, two ways to get the money back
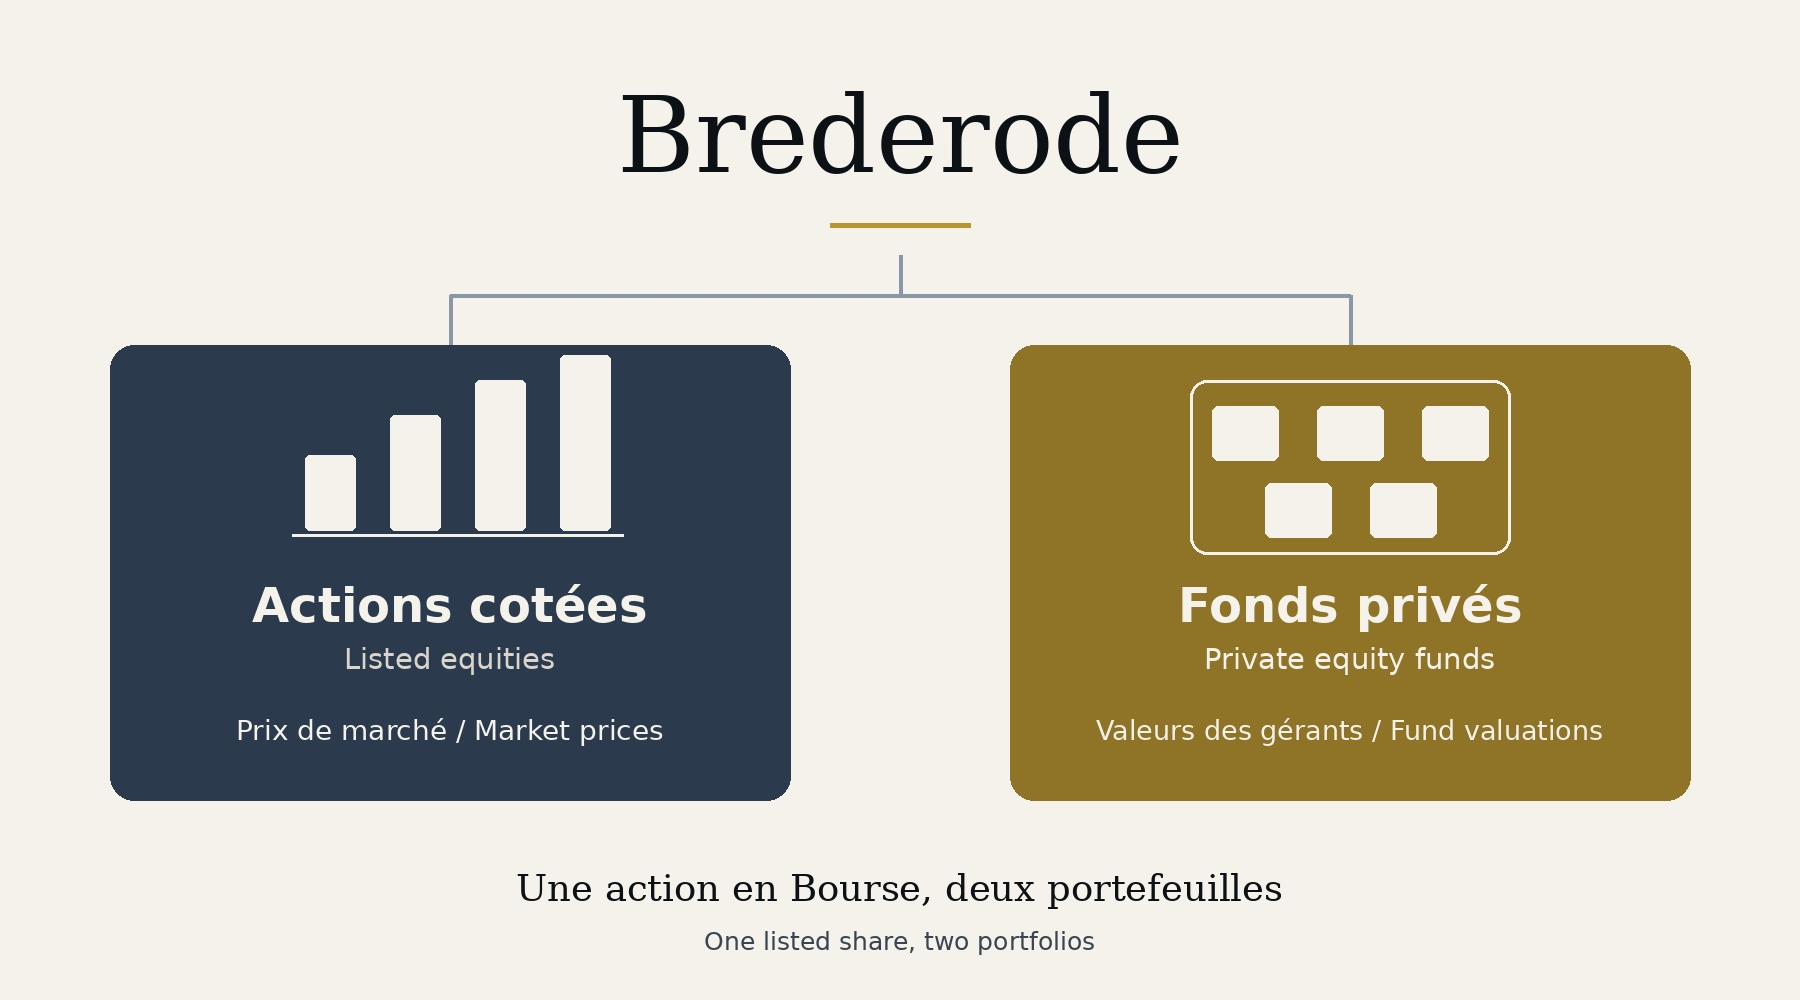
Brederode is a Luxembourg holding company listed in Brussels. It owns shares in companies such as Alphabet, Iberdrola and Mastercard. Their prices change every day on the stock market. It also holds interests in private equity funds. These funds buy unlisted businesses, develop them and eventually sell them.
At 30 June, Brederode and its subsidiaries held €2,694.55 million in private funds and €1,852.26 million in listed securities. Together, these investments totalled €4.55 billion, before cash, other assets and liabilities. The donut below covers all assets: €4.58 billion before deducting liabilities.

The donut shows the assets held. To establish what belongs to shareholders, we then deduct liabilities and the small minority interest.
| From assets to NAV, at 30 June 2026 | € million |
|---|---|
| Total assets, including cash | 4,578.70 |
| Less short-term financial debt | −23.39 |
| Less other liabilities | −23.49 |
| Less minority interests | −0.05 |
| Published net assets attributable to shareholders | 4,531.77 |
Brederode does have debt. But its €26.50 million of cash exceeds its €23.39 million of financial debt, leaving reported net cash of €3.11 million. Other liabilities include €19.19 million payable for purchases of financial assets. Positive net cash does not mean that all liabilities are zero.
The crucial difference is timing. A listed share can be sold in the market, subject to trading liquidity. To get money back from a private fund, Brederode usually waits for the manager to sell businesses and distribute the proceeds. Fund interests can sometimes be sold to another investor at a negotiated price.
Today's reported value and tomorrow's available cash are different questions. That is where an investigation into the discount begins.
Asset value and the share price measure different things
The €4.53 billion NAV adds assets and deducts liabilities. The €2.93 billion market capitalisation is the market price of all the shares: €100 × 29,305,586 shares on 1 October. The share price is observable; it does not guarantee that an acquirer could buy the entire company for that amount.

The gap between those two amounts is the discount. The following charts examine its history, then what it leaves for the funds under an explicit calculation assumption.
The market has changed its mind
At the end of 2021, investors were willing to pay slightly more than Brederode's NAV. At the end of June 2025, the discount was still only 12.5%. By 1 October 2026, it exceeded 35%.
Over that period, asset values and the share price moved in opposite directions. Published NAV rose 14% between June 2025 and June 2026. The share price fell 15% between June 2025 and 1 October 2026. Our 11 September analysis had already highlighted the gap.

The chart gives some perspective. A discount around 35% has happened before. Between 2012 and 2018, year-end observations ranged from 21% to 37%. Today's level resembles that earlier period. The sharper contrast is with the confidence investors showed in 2021 and still displayed in mid-2025.
How do we arrive at 43 cents?
Start with the €2.93 billion market capitalisation, the price of all the shares on 1 October. It is below the reported net value of the assets. To isolate what that price leaves for the funds, first assign their value to the other net assets.
We marked the seventeen named holdings to 1 October prices, keeping the quantities published in June and accounting for currencies. Together with other net assets, they were worth €1.76 billion. Subtract that from €2.93 billion and €1.17 billion remains for the private funds.

The €1.76 billion of net assets excluding funds includes €1,779.71 million of revalued listed securities, plus €26.50 million of cash and €5.39 million of other assets and rounding, less €46.88 million of liabilities and €0.05 million of minority interests. Cash and liabilities are therefore included in this subtraction.
Updating only listed share prices to 1 October gives €4.46 billion of modelled NAV: €2.69 billion of funds plus €1.76 billion of other net assets. This fixed-position estimate is distinct from June’s officially reported €4.53 billion. It reconciles the calculation’s asset base with the €2.93 billion market capitalisation.
The funds are recorded in the accounts at €2.69 billion. Dividing the remaining €1.17 billion by that value gives approximately 0.43. For every euro of funds recorded in the accounts, the share price leaves 43 cents.
This assumes the other assets are worth their updated values and allocates that full amount to them. It concentrates the entire discount on the funds. Trading liquidity and the holding company structure may also explain some of the gap. Brederode's own operating costs are low, at 0.10% of the portfolio a year, excluding fees within the funds.
Jefferies offers a benchmark by tracking fund interests traded between professional investors. In 2025, buyout funds sold for an average of 92% of their reported value. Funds more than ten years old, across all strategies, sold for 73%.
The distance from 43 cents is striking. A buyer of fund interests, however, selects individual funds and negotiates the transfer. A Brederode shareholder buys the entire portfolio through a relatively lightly traded share. The comparison helps frame the question without providing a target valuation for the holding company.
The first problem is time
Co-chief executives Nicolas-Louis Pinon and Dimitri van der Mersch describe slower maturation and delayed distributions in some older funds in the half-year report. They signed it on 7 September on behalf of the board.
Waiting changes the return. An investment that doubles in five years earns 14.9% a year. Taking seven years to receive the same amount reduces the annual return to 10.4%. The final gain is unchanged, but the capital has worked for two more years.
At Brederode, funds committed to before 2018 still account for 19% of private equity, approximately €512 million. Significant capital remains invested in older generations. Across the industry, Bain estimated in June that funds still held about 33,000 companies.
There is evidence against a blanket deterioration. In the first half, Brederode received €16.76 million more from its funds than it paid into them. MSCI data cited by Bain also show that 75% of businesses actually sold by buyout funds exit above their penultimate valuation. Sales provide a favourable test. The question remains with businesses still awaiting a buyer.
Vintages: when Brederode promised its capital
A vintage here identifies the year Brederode committed to a fund. A 2021 commitment can finance acquisitions spread over several years. It dates the generation of the fund, while each business has its own acquisition date.
The next chart shows where capital remained invested at 30 June 2026. A taller bar means a generation still accounts for a larger share of the portfolio's value.

Two observations matter. Funds from before 2018 still have significant capital to return. The 2021 and 2022 funds together represent 28% of private equity, or 16.6% of NAV. They were launched around a period of high prices. The largest individual vintage remains 2019, at 18%.
Software illustrates the risk. Software Equity Group puts the median acquisition price of subscription software companies at 7.3 times revenue in 2021, compared with 4 times in the second quarter of 2026. The samples have changed, but the contrast shows how much the entry price can matter.
Bain also finds weaker returns so far from North American technology buyouts completed between 2020 and 2022 than from those in the previous decade. At Brederode, software specialists Vista and PSG account for €204 million, or 4.5% of NAV. Other managers may also hold software businesses.
The useful question is whether June's reported values adequately reflect the prices achievable when businesses are sold. Those values may already incorporate some of the decline in multiples. Exits will test the remaining gap.
With debt, a small price decline makes a big difference
Buyout funds account for 58% of Brederode's private equity, approximately €1.56 billion. They often borrow to acquire companies. Brederode itself has little debt, with net cash of €3.11 million at the end of June. Much of the leverage sits further down, inside the acquired businesses.
Take a hypothetical company worth 1,000, with 600 of debt. That leaves 400 for its shareholders. If the business can only be sold for 900, debt stays at 600 and shareholders receive 300. The company's price falls 10%, while their equity value falls 25%.
Debt magnifies the decline
Company value: 1,000 → 900. Unchanged debt: 600. Shareholder value falls 25%.
More interest, less cash
Debt of 600 costs 30 a year at 5%, then 42 at 7%. Less cash remains to repay debt or distribute.
Higher rates matter when debt has a floating rate or needs refinancing. They can slow repayments and reduce what eventually returns to investors. The exposure depends on each company's contracts, hedges and growth. Fund values already reflect underlying debt, so it cannot be deducted again.
Promised capital has its own timetable
At the end of June, Brederode still had €1.34 billion to pay into funds, up 12.5% in six months. It made €255 million of new commitments in the first half. These amounts will be called gradually as investments are made.
This is the idea behind the J-curve. In the early years, a fund asks for money to acquire businesses and pay fees. Sales and distributions come later. Brederode must fund its new investments while waiting for older funds to return capital.
It has €350 million of committed credit facilities and approximately €1.66 billion of shares in other companies, marked to 1 October prices. Own shares are excluded from that reserve. The amount of credit actually available remains to be verified.
As an illustration, a call of 20% of outstanding commitments would require €268 million, before any distributions received. A capital call turns cash into an investment. Pressure would come from a lasting mismatch between cash going out and coming back. Selling listed shares to cover that mismatch would increase the weight of private funds in the portfolio.
Generations also matter here. Some 53% of uncalled commitments concern funds from 2024 to 2026. These funds can continue investing in a different environment from those launched around the 2021 peak.
What the discount asks us to check
Listed share movements explain part of the decline, but not all of it. At constant quantities, marking those investments to current prices reduces NAV by about 1.6% from June, while Brederode shares fall 4.4%. With only 5,862 shares traded per day on average in the first half, a few sessions can nevertheless give a misleading picture.
The evidence will accumulate over a longer period. Three things matter: cash returned by older funds, the pace of new calls and the prices achieved in exits. The next NAV statement for 30 September will update the picture, on a publication date still to be confirmed.
One final calculation puts the doubt in perspective. After updating listed share prices, a hypothetical 30% reduction in all fund values would still leave a discount around 20%. Those values would have to fall approximately 57% to erase the entire gap through that explanation alone.
The market may therefore charge for waiting, uncertainty and the difficulty of selling, alongside potential losses. The 43 cents make that question tangible. Future cash distributions will tell us more than a handful of stock market sessions.
How we calculated the figures
Scope and rounding. The donut uses the economic breakdown of assets held by Brederode and its subsidiaries on page 5, rather than Brederode S.A.’s standalone balance sheet on page 18. Its denominator is €4,578.70m of total assets, before deducting €46.88m of liabilities and €0.05m of minority interests. Adding the two rounded investment lines gives €4,546.81m, compared with the reported financial-assets subtotal of €4,546.82m. Other reported asset items total €0.17 + €3.15 + €2.05 = €5.37m; “other assets and rounding” of €5.39m includes the €0.02m rounding differences needed to reconcile with reported total assets. Liabilities are shown separately; the donut contains no negative slice. Other liabilities of €23.49m equal €46.88m less €23.39m of financial debt. The €1,341.08m of uncalled commitments is not a recognised liability to be deducted again.
Discount. Closing share price compared with published NAV per share. Year-end figures come from annual reports for 2012 to 2025, and June figures from half-year reports. The 35.3% discount at 1 October uses published NAV at 30 June.
| Date | Share price, € | Published NAV per share, € | Discount, % |
|---|---|---|---|
| 2012-12-31 | 23.95 | 35.22 | 32.0 |
| 2013-12-31 | 27.50 | 38.18 | 28.0 |
| 2014-12-31 | 29.10 | 45.80 | 36.5 |
| 2015-12-31 pro forma | 40.50 | 53.05 | 23.7 |
| 2016-12-31 | 41.76 | 58.20 | 28.2 |
| 2017-12-31 | 49.69 | 63.22 | 21.4 |
| 2018-12-31 | 50.40 | 68.59 | 26.5 |
| 2019-12-31 | 74.60 | 83.27 | 10.4 |
| 2020-12-31 | 81.20 | 91.19 | 11.0 |
| 2021-12-31 | 127.80 | 125.45 | -1.9 |
| 2022-12-31 | 108.60 | 121.80 | 10.8 |
| 2023-12-31 | 101.60 | 128.55 | 21.0 |
| 2024-12-31 | 111.00 | 141.36 | 21.5 |
| 2025-06-30 | 118.20 | 135.16 | 12.5 |
| 2025-12-31 | 106.80 | 144.24 | 26.0 |
| 2026-06-30 | 104.60 | 154.64 | 32.4 |
| 2026-10-01 | 100.00 | 154.64 | 35.3 |
The series uses consolidated accounts for 2012 to 2014, the 2015 pro forma presented in the 2016 report, then individual IFRS accounts. Each historical discount compares share price and NAV for the same period. The October comparison uses June's published NAV.
Implicit price per euro of private equity. Market capitalisation less NAV excluding private equity, divided by reported private equity value. The calculation assumes listed shares and other net assets are worth their stated values without a discount. It therefore assigns the entire discount to the funds. At 1 October, net assets excluding private equity are updated using that day's listed share prices, June quantities and ECB reference exchange rates. Other items are unchanged. Reconstructed NAV is €152.16 per share. Market capitalisation is €100 multiplied by 29,305,586 shares.
Own shares. Brederode subsidiaries hold 1,204,575 Brederode shares. The report includes them in the listed portfolio at their share price and counts them in the number of shares. We follow that presentation.
Listed investments marked to 1 October prices.
| Holding | Value at 30 June, €m | Change in euros since June | Effect, €m |
|---|---|---|---|
| Alphabet C | 274.01 | -4.40% | -12.06 |
| Iberdrola | 211.08 | -5.08% | -10.73 |
| Samsung Electronics, GDR | 166.00 | -8.32% | -13.81 |
| Mastercard | 141.52 | +8.00% | +11.31 |
| Enel | 138.25 | -13.76% | -19.03 |
| Intel | 138.11 | -13.33% | -18.41 |
| Brederode, own shares | 126.00 | -4.40% | -5.54 |
| Royal Bank of Canada | 120.82 | -4.65% | -5.62 |
| Novartis | 112.42 | -8.84% | -9.94 |
| Unilever | 75.85 | -0.02% | -0.02 |
| RELX | 65.00 | +7.08% | +4.60 |
| Siemens | 64.69 | -3.29% | -2.13 |
| LVMH | 60.22 | -21.60% | -13.01 |
| Atlas Copco A | 42.79 | +2.72% | +1.16 |
| Microsoft | 38.53 | +38.65% | +14.89 |
| Experian | 37.50 | -3.65% | -1.37 |
| Deutsche Börse | 35.58 | +20.06% | +7.14 |
| Other, not repriced | 3.89 | 0 | |
| Total | 1,852.26 | -3.92% | -72.55 |
The seventeen named holdings account for 99.8% of the listed portfolio. The calculation excludes transactions, dividends, fees and taxes since June. Samsung is tracked through its dollar-denominated GDR. British prices are converted from pence to pounds. ECB exchange rates are reference rates, rather than closing rates.
Secondary market. Jefferies prices concern fund interests traded between professional investors. They provide a benchmark, rather than a discount that can be directly applied to a holding company share.
Vintages and strategies. Read from the charts on page 9 of the half-year report, in rounded percentages. Buyout represents 58% of invested values and 68% of uncalled commitments.
Sensitivity calculations. In this model, the discount reaches zero after an exact 56.7317% reduction in private equity values. These scenarios apply to fund interests already valued net of underlying company debt. Applying leverage again would count it twice.
Liquidity. The €350 million of credit facilities are committed. Their drawn amount is not disclosed. Short-term debt of €23.39 million and cash of €26.50 million give net cash of €3.11 million.
Industry benchmarks. Bain's findings on North American technology buyouts from 2020 to 2022 use StepStone's April 2026 sample. They concern gross multiples on fully or at least partially realised deals, rather than net returns on Brederode's funds. Software Equity Group medians and Bain's findings describe market samples. Neither describes the specific funds or businesses owned by Brederode.
Sources
- Brederode, half-year report at 30 June 2026, published 10 September: pp. 1, 3, 5-6, 9, 11, 14-16 and 21; vintage and strategy charts read in the original PDF
- Stock Analysis / S&P Global, Brederode: 22 September and 1 October closing prices, accessed 2 October 2026
- Stock Analysis / S&P Global, Alphabet C: 1 October closing price cross-checked 3 October 2026
- Stock Analysis / S&P Global, Iberdrola: 1 October closing price cross-checked 3 October 2026
- Stock Analysis / S&P Global, Samsung GDR: 1 October closing price cross-checked 3 October 2026
- Stock Analysis / S&P Global, Mastercard: 1 October closing price cross-checked 3 October 2026
- Stock Analysis / S&P Global, Enel: 1 October closing price cross-checked 3 October 2026
- Stock Analysis / S&P Global, Intel: 1 October closing price cross-checked 3 October 2026
- Stock Analysis / S&P Global, Brederode through subsidiaries: 1 October closing price cross-checked 3 October 2026
- Stock Analysis / S&P Global, Royal Bank of Canada: 1 October closing price cross-checked 3 October 2026
- Stock Analysis / S&P Global, Novartis: 1 October closing price cross-checked 3 October 2026
- Stock Analysis / S&P Global, Unilever: 1 October closing price cross-checked 3 October 2026
- Stock Analysis / S&P Global, RELX: 1 October closing price cross-checked 3 October 2026
- Stock Analysis / S&P Global, Siemens: 1 October closing price cross-checked 3 October 2026
- Stock Analysis / S&P Global, LVMH: 1 October closing price cross-checked 3 October 2026
- Stock Analysis / S&P Global, Atlas Copco A: 1 October closing price cross-checked 3 October 2026
- Stock Analysis / S&P Global, Microsoft: 1 October closing price cross-checked 3 October 2026
- Stock Analysis / S&P Global, Experian: 1 October closing price cross-checked 3 October 2026
- Stock Analysis / S&P Global, Deutsche Börse: 1 October closing price cross-checked 3 October 2026
- ECB, reference exchange-rate history for June, 22 September and 1 October 2026
- Software Equity Group, SaaS M&A Snapshot, published 14 March 2023: acquisition multiples in 2021 and 2022
- Software Equity Group, second-quarter 2026 SaaS report: public page accessed 2 October; listed-company and transaction samples are distinct
- Bain & Company, Software Investing in the Age of AI and Slower Growth, 29 September 2026: figures 1-2 and StepStone sample limitations
- Jefferies, 2025 global secondary market review, published 10 February 2026, accessed 2 October: prices by strategy and age
- Bain & Company, midyear report release: page dated 7 June, text dated 8 June 2026; MSCI exit valuation test
- Vista, enterprise software private equity strategy, accessed 2 October 2026
- PSG, official 2025 review: software and technology services strategy, accessed 2 October 2026
- EQT, private equity strategy by sector, accessed 2 October 2026; the page does not identify the funds to which Brederode committed
- Arlington, strategy and sectors, accessed 2 October 2026
- Samsung, official listing information and GDR ISINs, accessed 2 October 2026
- Iberdrola, July 2026 flexible remuneration, release dated 2 July
- Brederode, official financial reports for 2012-2025: key figures and NAVs reviewed 3 October 2026
Share this article